UI
UI is the area for what end users see: dashboards, process diagrams, symbols and reports. Select UI in the rail; the tabs are:
| Tab | Purpose |
|---|---|
| MeshBoards | Dashboards made of widgets (KPIs, gauges, charts, tables) on saved queries. A board can be pinned to Home. |
| Process diagrams | Interactive diagrams of processes, systems and equipment that show runtime data. |
| Symbol libraries | Libraries of reusable graphical symbols, with the Symbol Designer to create them. |
| Reports | The report explorer: folders and files with the buttons Upload and New folder. Not described yet. |
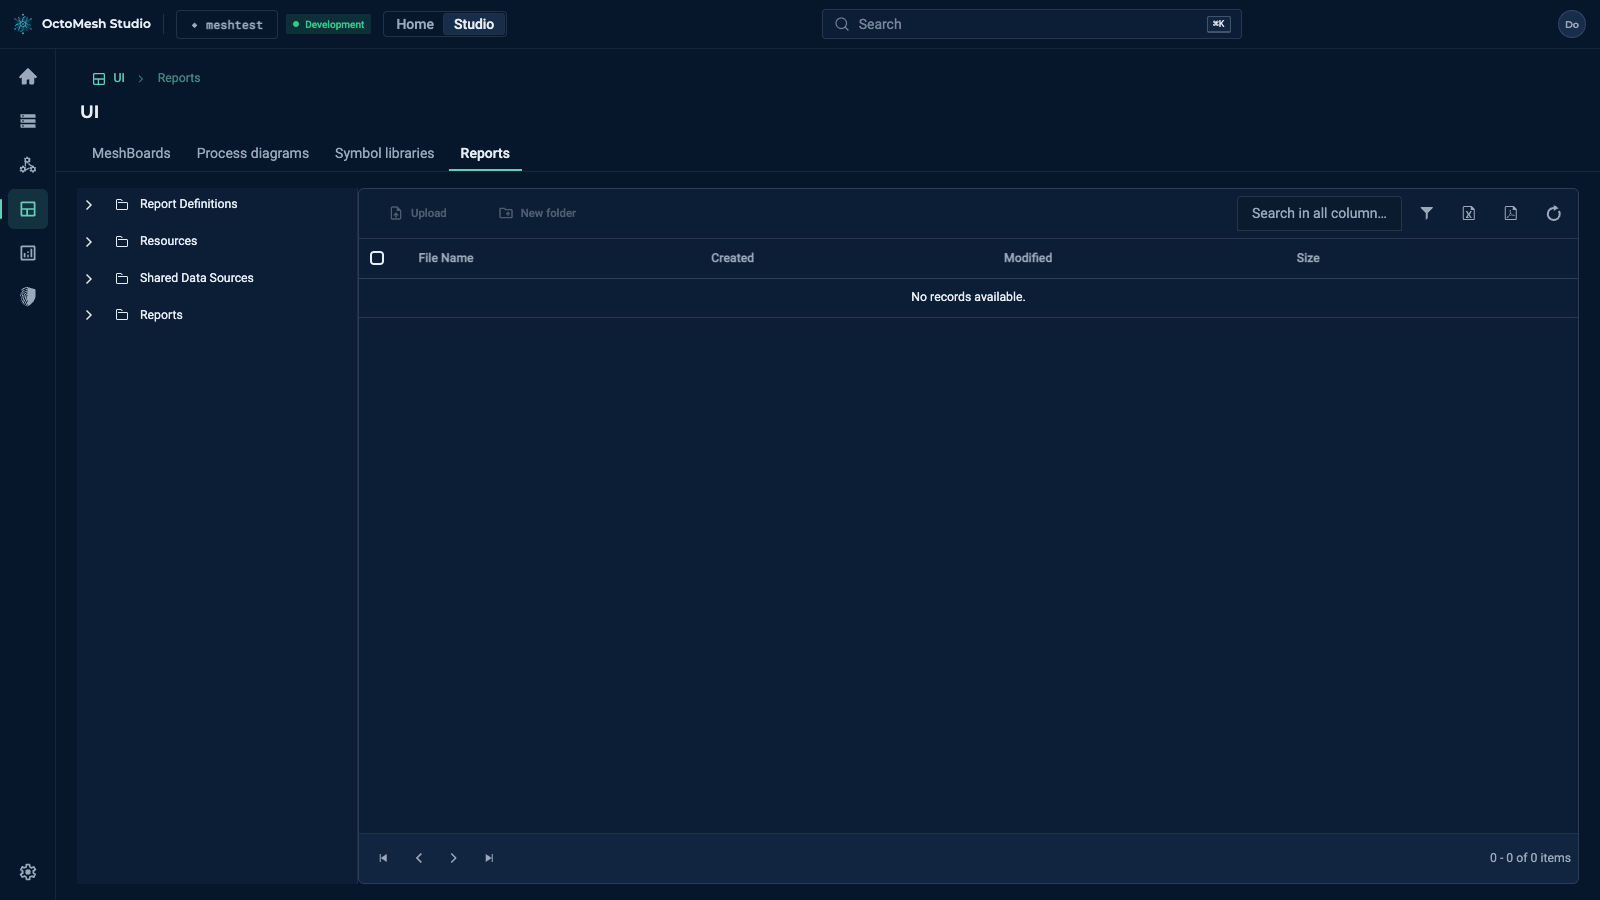
Reports appear only here: in Studio mode the Home area does not list them.