Events
Events lists the messages that the platform services write about what they did: for example that an adapter registered, that its configuration was deployed, that a trigger schedule was updated or that an adapter without a live connection was set to Offline. It is the first place to look when something did not happen.
Open it with Operate > Events (role AdminPanelManagement).
The list
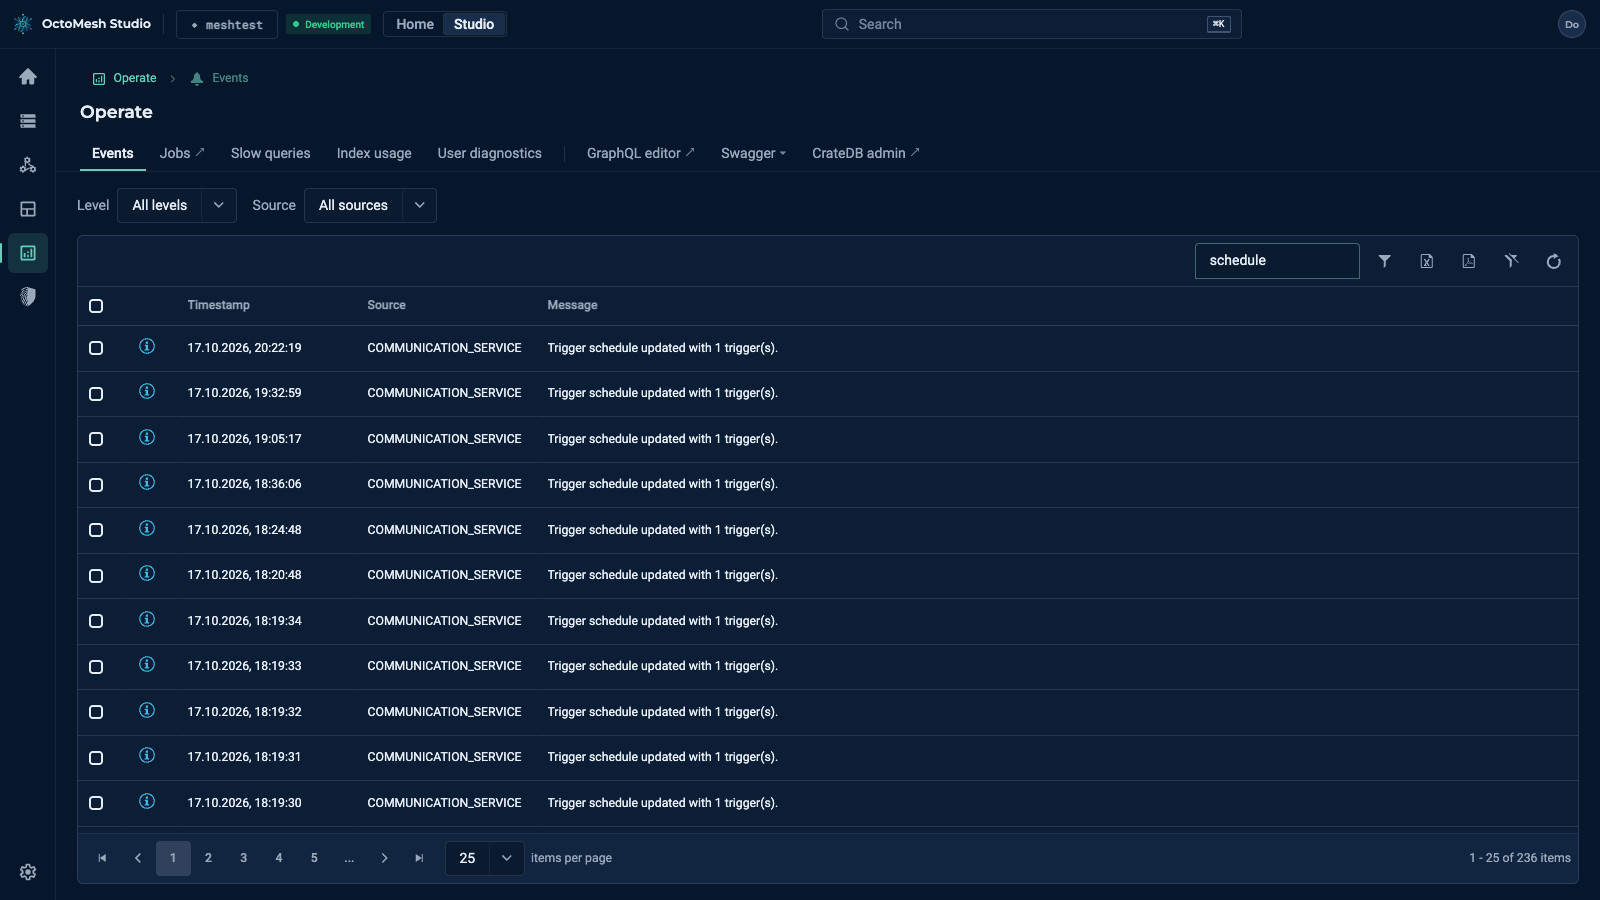
The columns are Timestamp, Source and Message; the newest event is first. Two filters narrow the list:
- Level: All levels, Critical, Error, Warning, Information or Debug. Set it to Error (or Critical) to see failures; the Message names the entity and says what went wrong.
- Source: All sources, Admin panel, Asset repository, Bot service, Communication service, Identity service or Adapter.
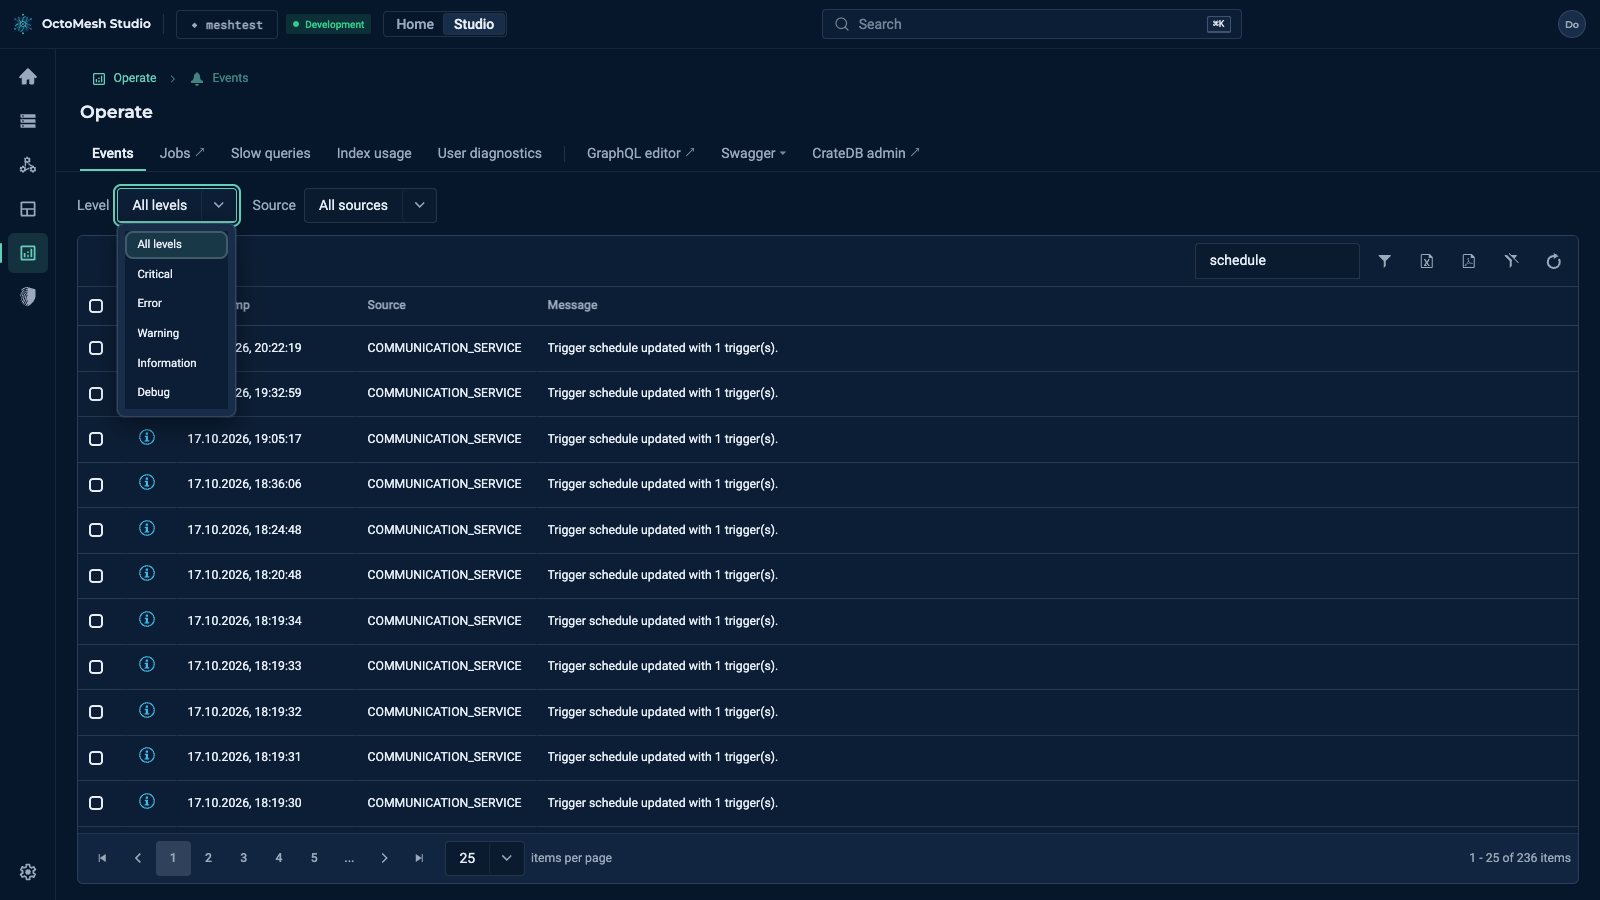
The toolbar has Show Row Filter, Export to Excel, Export to PDF and Refresh Data; the grid is paged.
Failed or pending?
A failure shows up as an event of level Error or Critical with the reason in the Message. A run that has not happened yet (pending, waiting for its schedule or for an adapter) produces no event of its own: look at the state of the entity instead, for example the deployment state of an adapter or the trigger state in the data flow (Integration). The events of one adapter, deployment site or data flow are also reachable with Show events in the row menu of that entity.
More
For the services that write the events see Architecture in the Technology Guide.