Process Diagrams
Process Diagrams in OctoMesh Refinery Studio allow you to create interactive visualizations of your processes, systems, and equipment. They combine primitive shapes, symbols from your libraries, and connections to represent complex systems.
Process Diagram List
Navigate to UI > Process Diagrams to view and manage your diagrams.
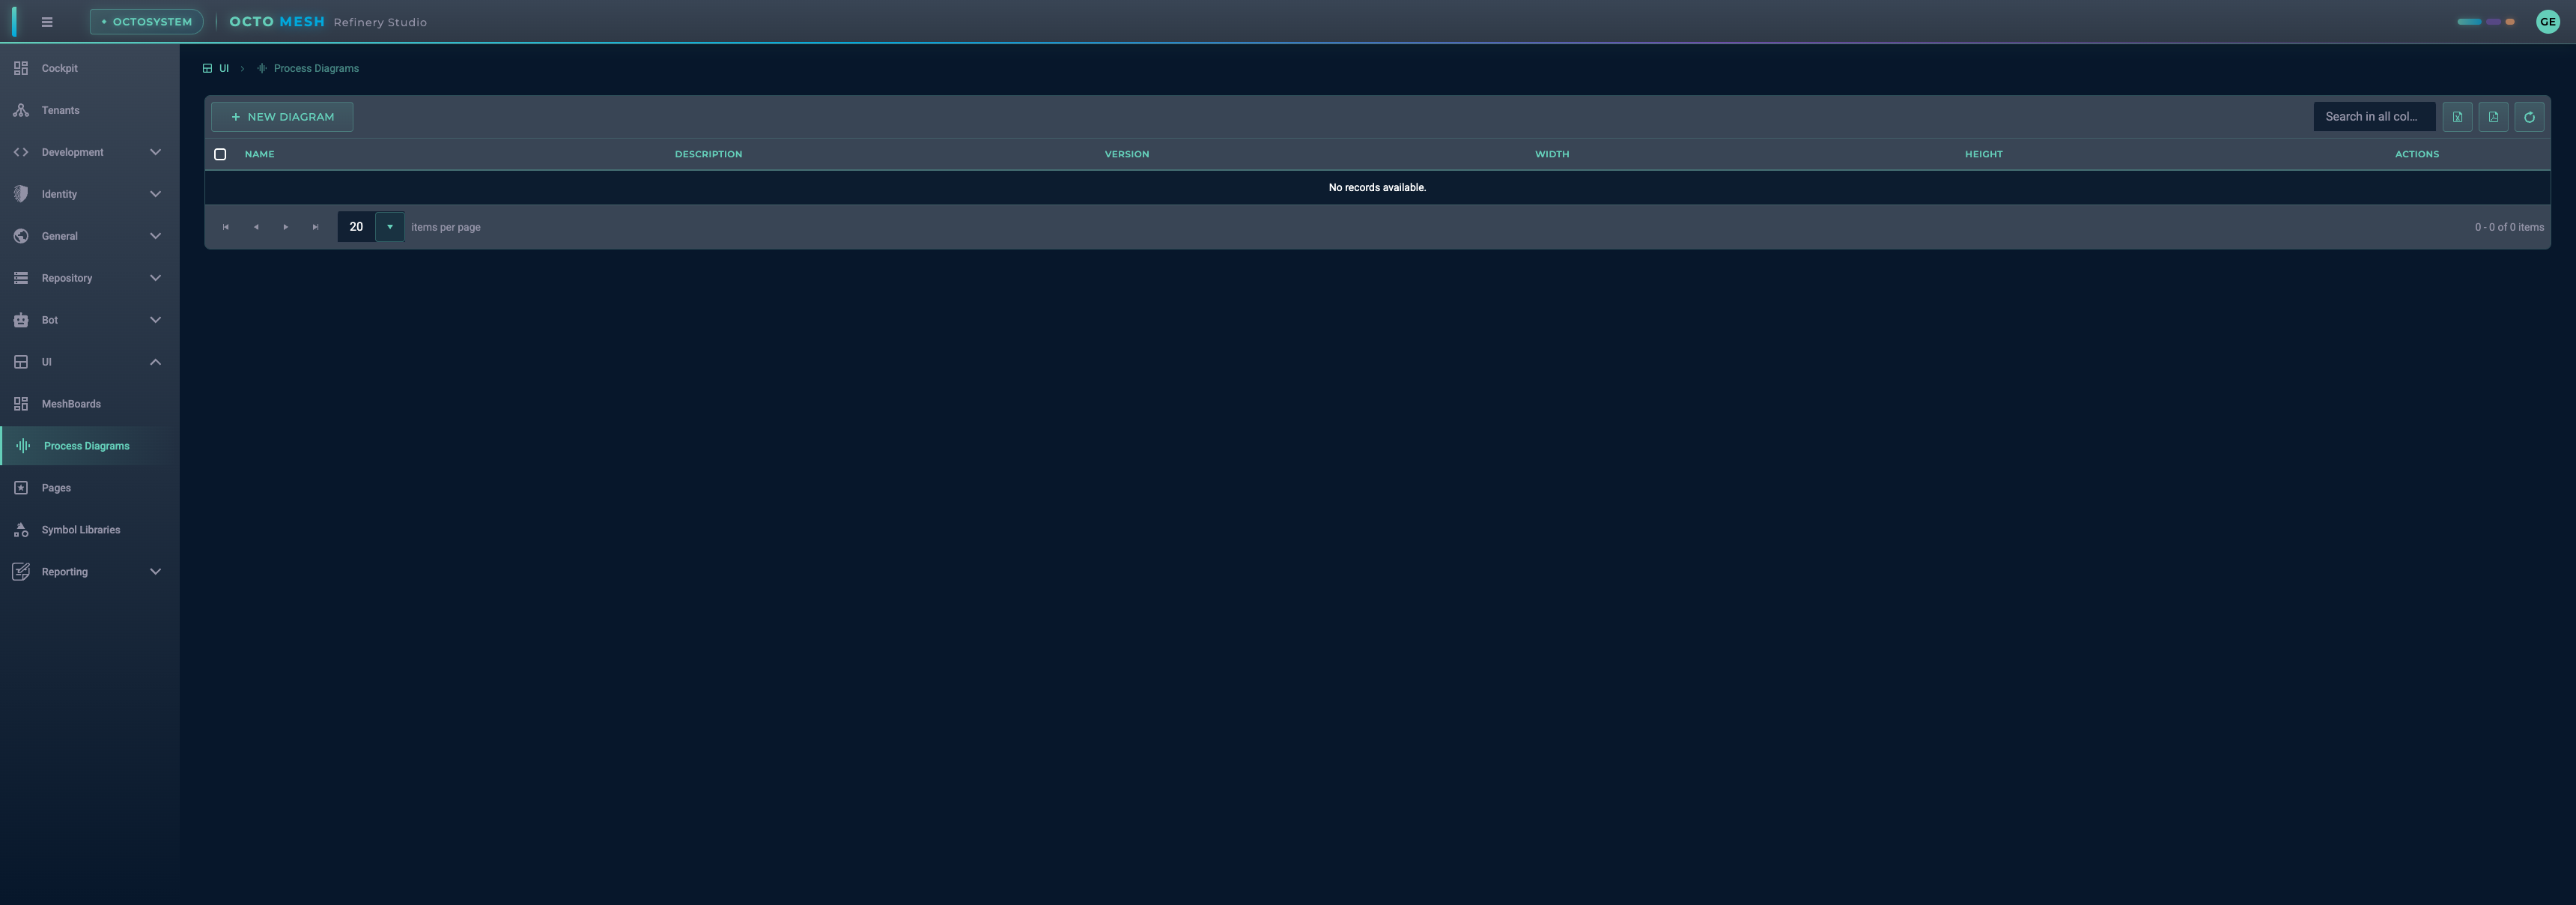
The list shows:
- Name: Diagram name
- Description: Optional description
- Version: Version number
- Width/Height: Canvas dimensions
- Actions: Edit, delete, duplicate
Creating a New Diagram
- Click NEW DIAGRAM
- Enter a name for your diagram
- Click CREATE
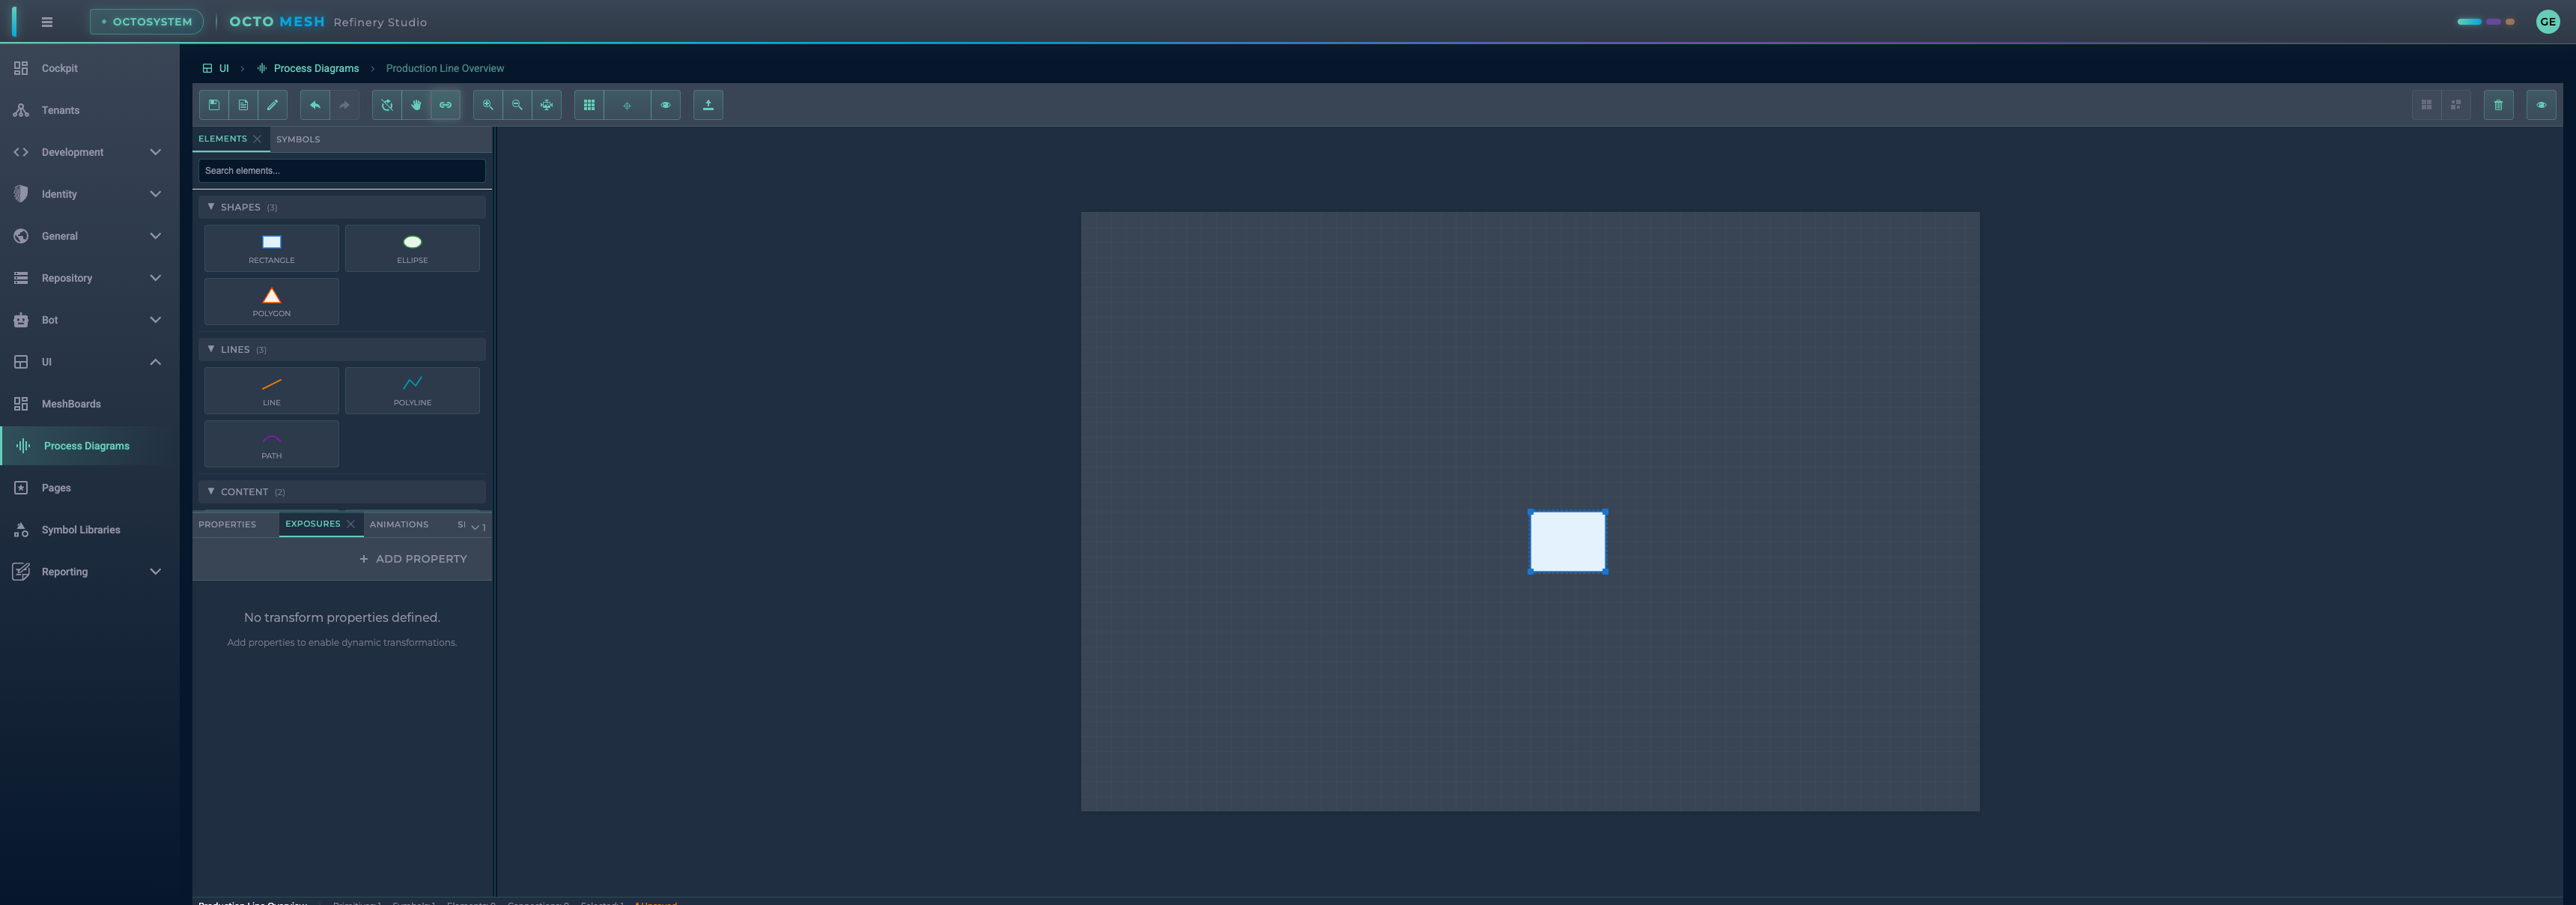
The Diagram Editor Interface
The diagram editor provides a canvas for building your process visualizations.
Toolbar
The toolbar provides essential editing tools:
| Tool Group | Tools | Description |
|---|---|---|
| File | Save, Save As, Rename | Save and manage your diagram |
| History | Undo (Ctrl+Z), Redo | Undo and redo changes |
| Tools | Select (V), Pan (H), Connect (C) | Switch between editing modes |
| View | Zoom In/Out, Fit to View | Control canvas zoom |
| Grid | Show Grid, Snap to Grid, Show Names | Toggle visual aids |
| Import | Import SVG | Import SVG graphics |
| Edit | Group, Ungroup, Delete | Organize and remove elements |
| Panels | View Panels | Show/hide side panels |
Left Panel - Content Sources
The left panel has two tabs for adding content to your diagram:
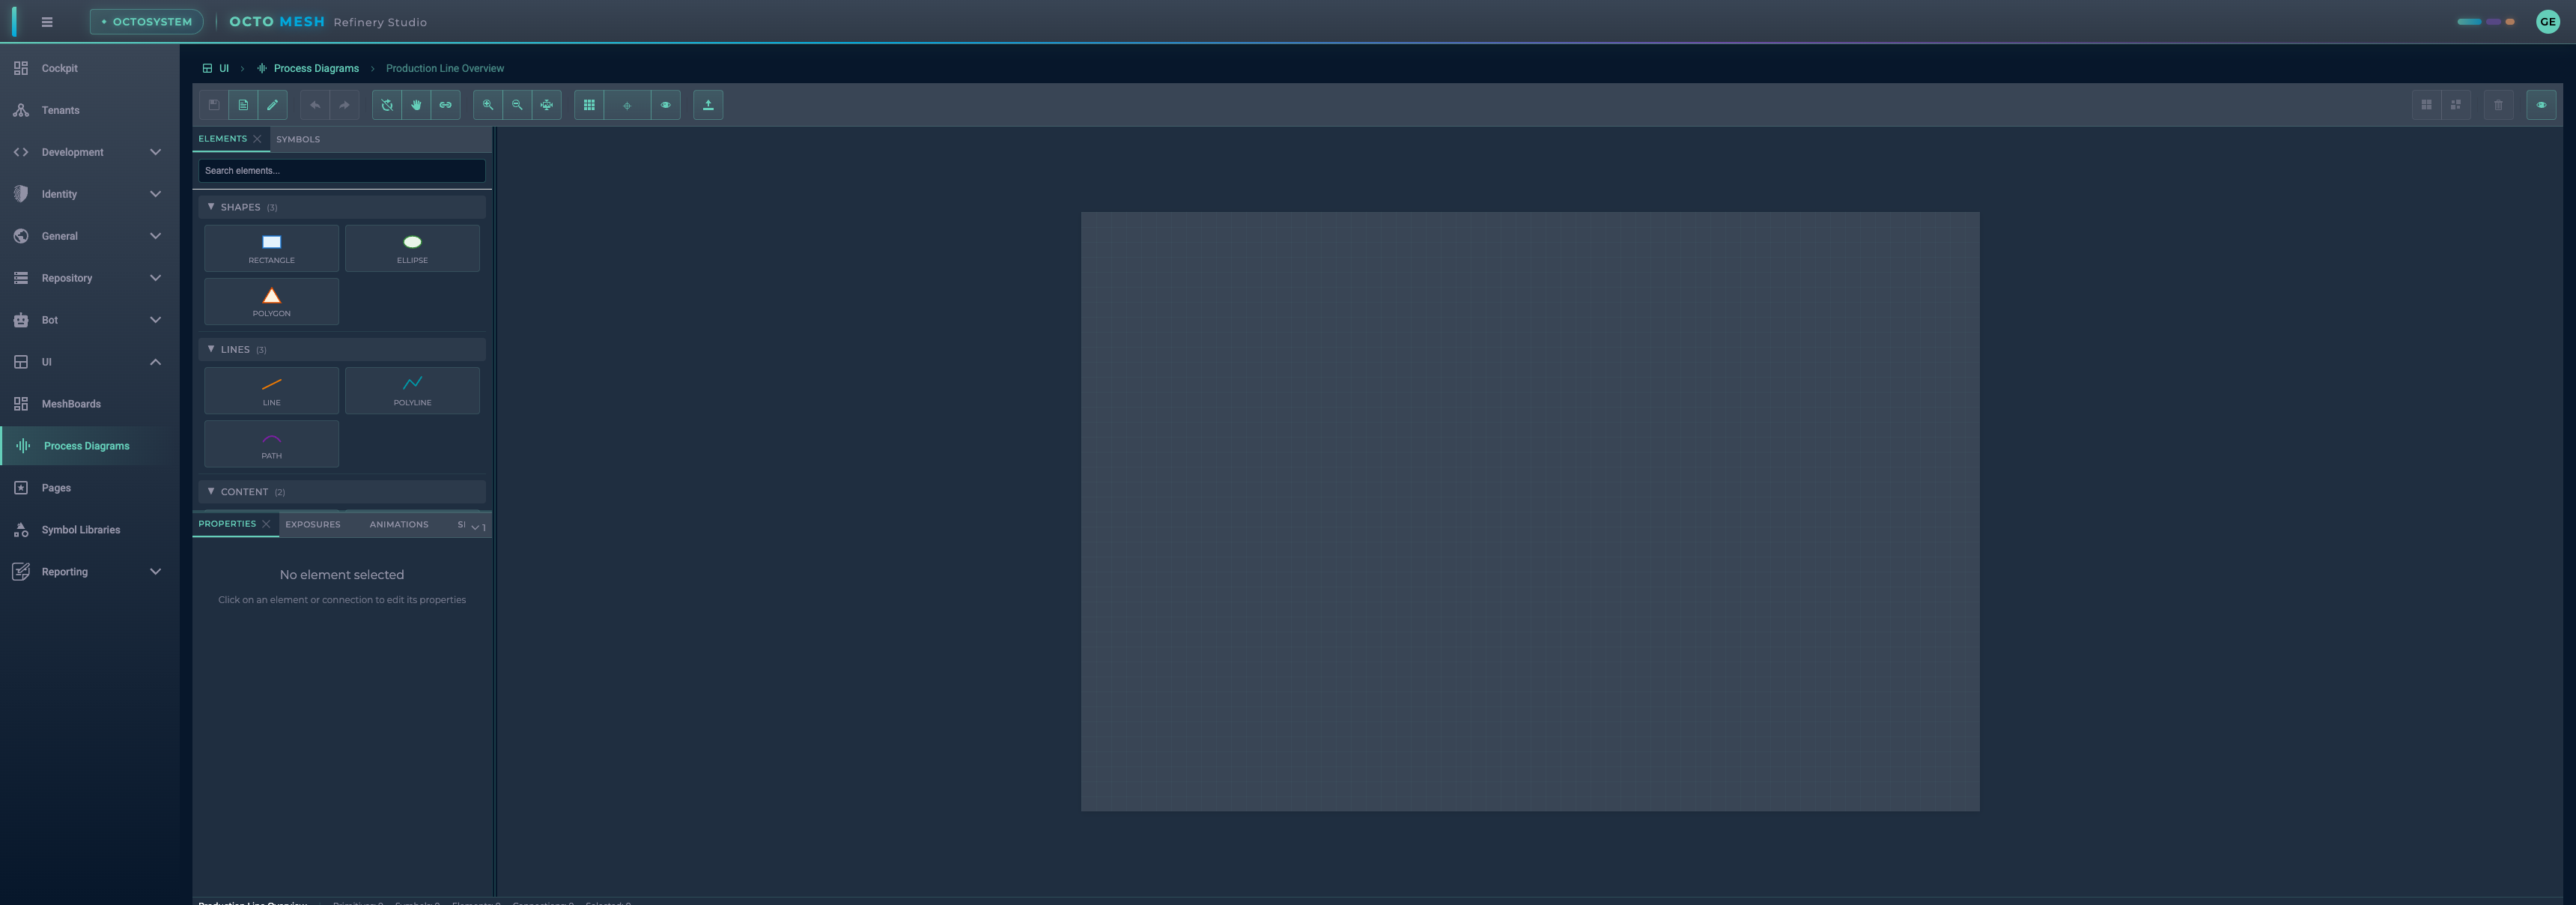
ELEMENTS Tab
Drag and drop primitive shapes onto the canvas:
Shapes:
- Rectangle: Basic rectangular shapes
- Ellipse: Circles and ovals
- Polygon: Multi-sided shapes
Lines:
- Line: Straight lines
- Polyline: Connected line segments
- Path: Complex SVG paths
Content:
- Text: Text labels
- Image: Embedded images
SYMBOLS Tab
Browse and use symbols from your Symbol Libraries:
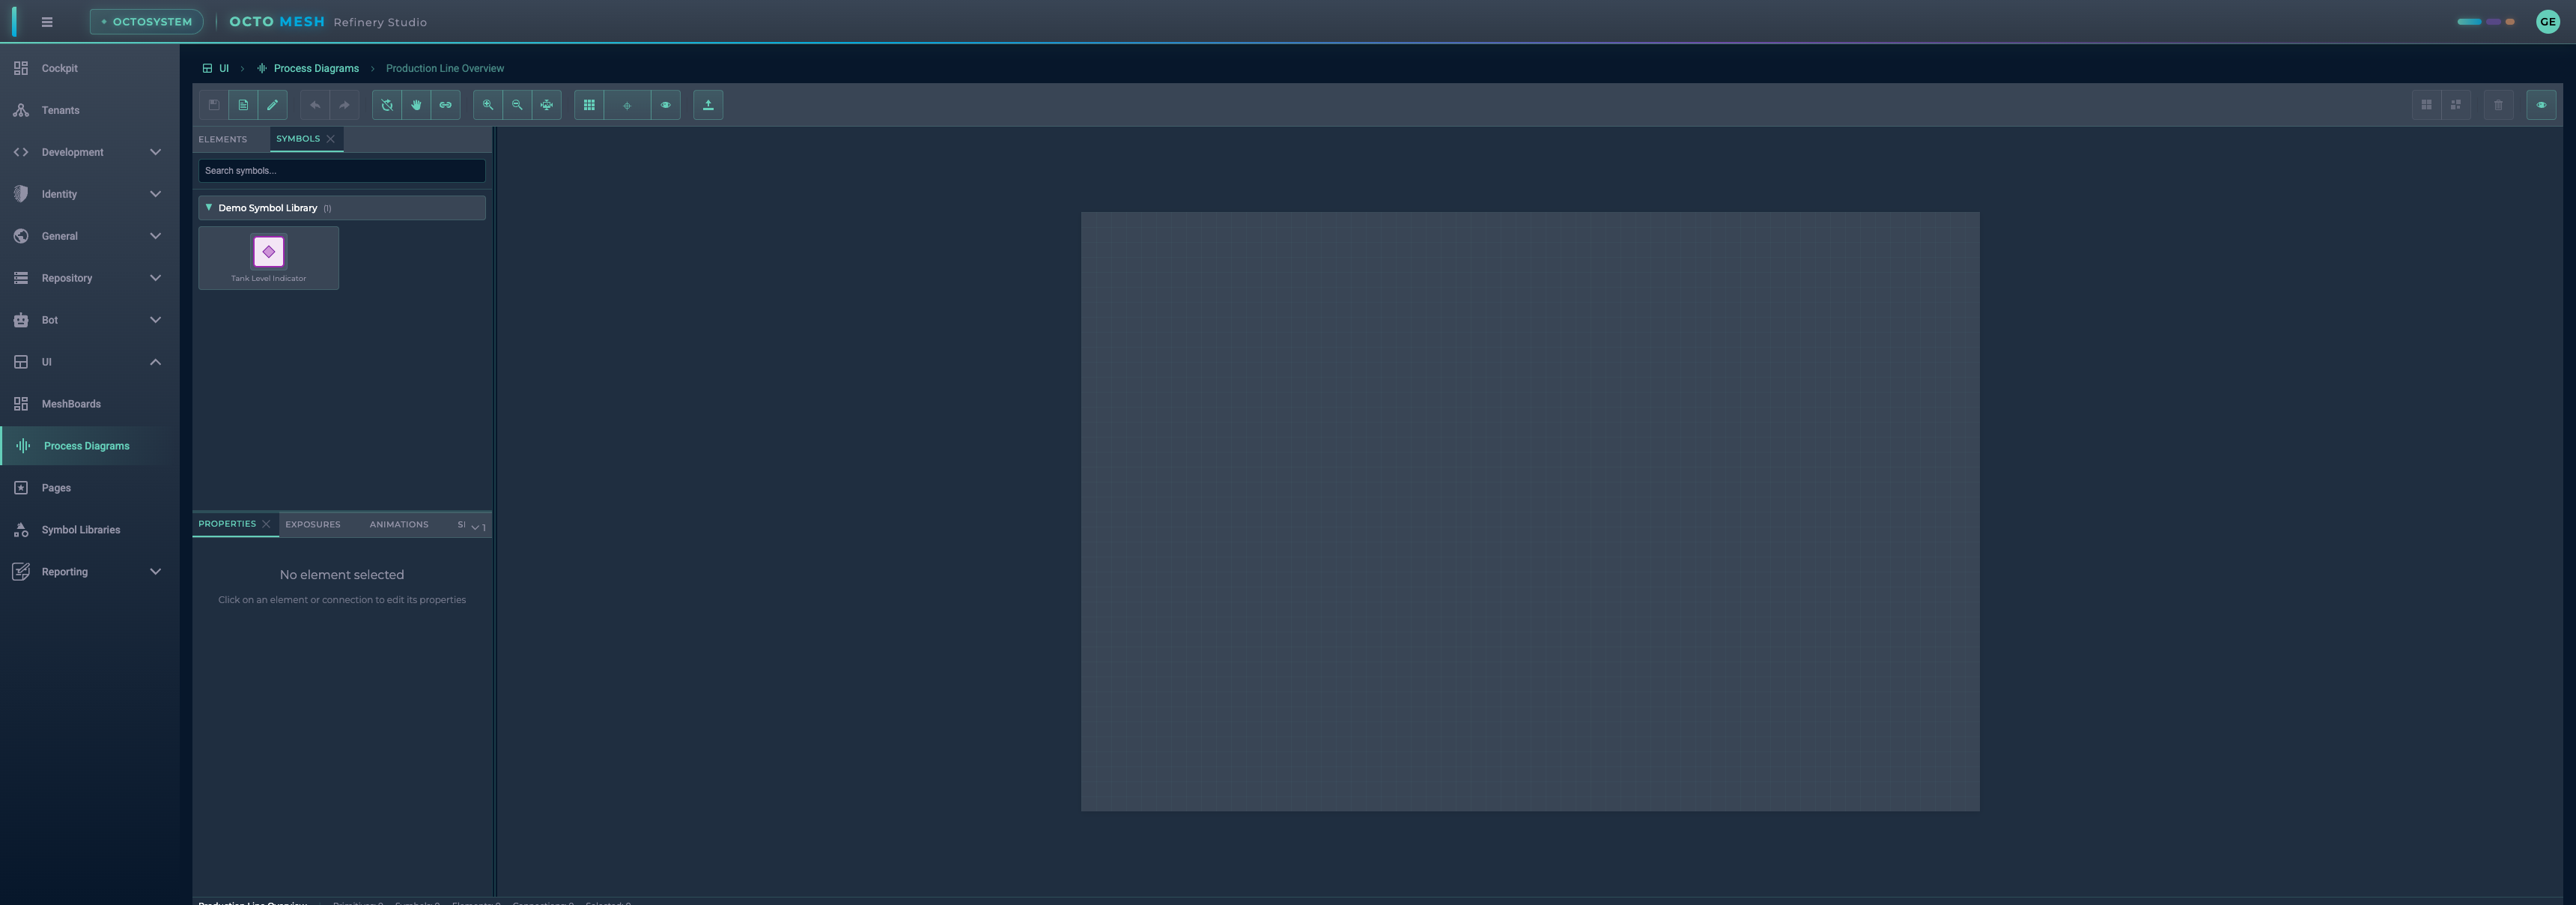
- Symbols are organized by library
- Drag symbols onto the canvas to create instances
- Each instance can have its own property values
Right Panel - Properties and Configuration
PROPERTIES Tab
When selecting a symbol instance, the Properties tab shows:
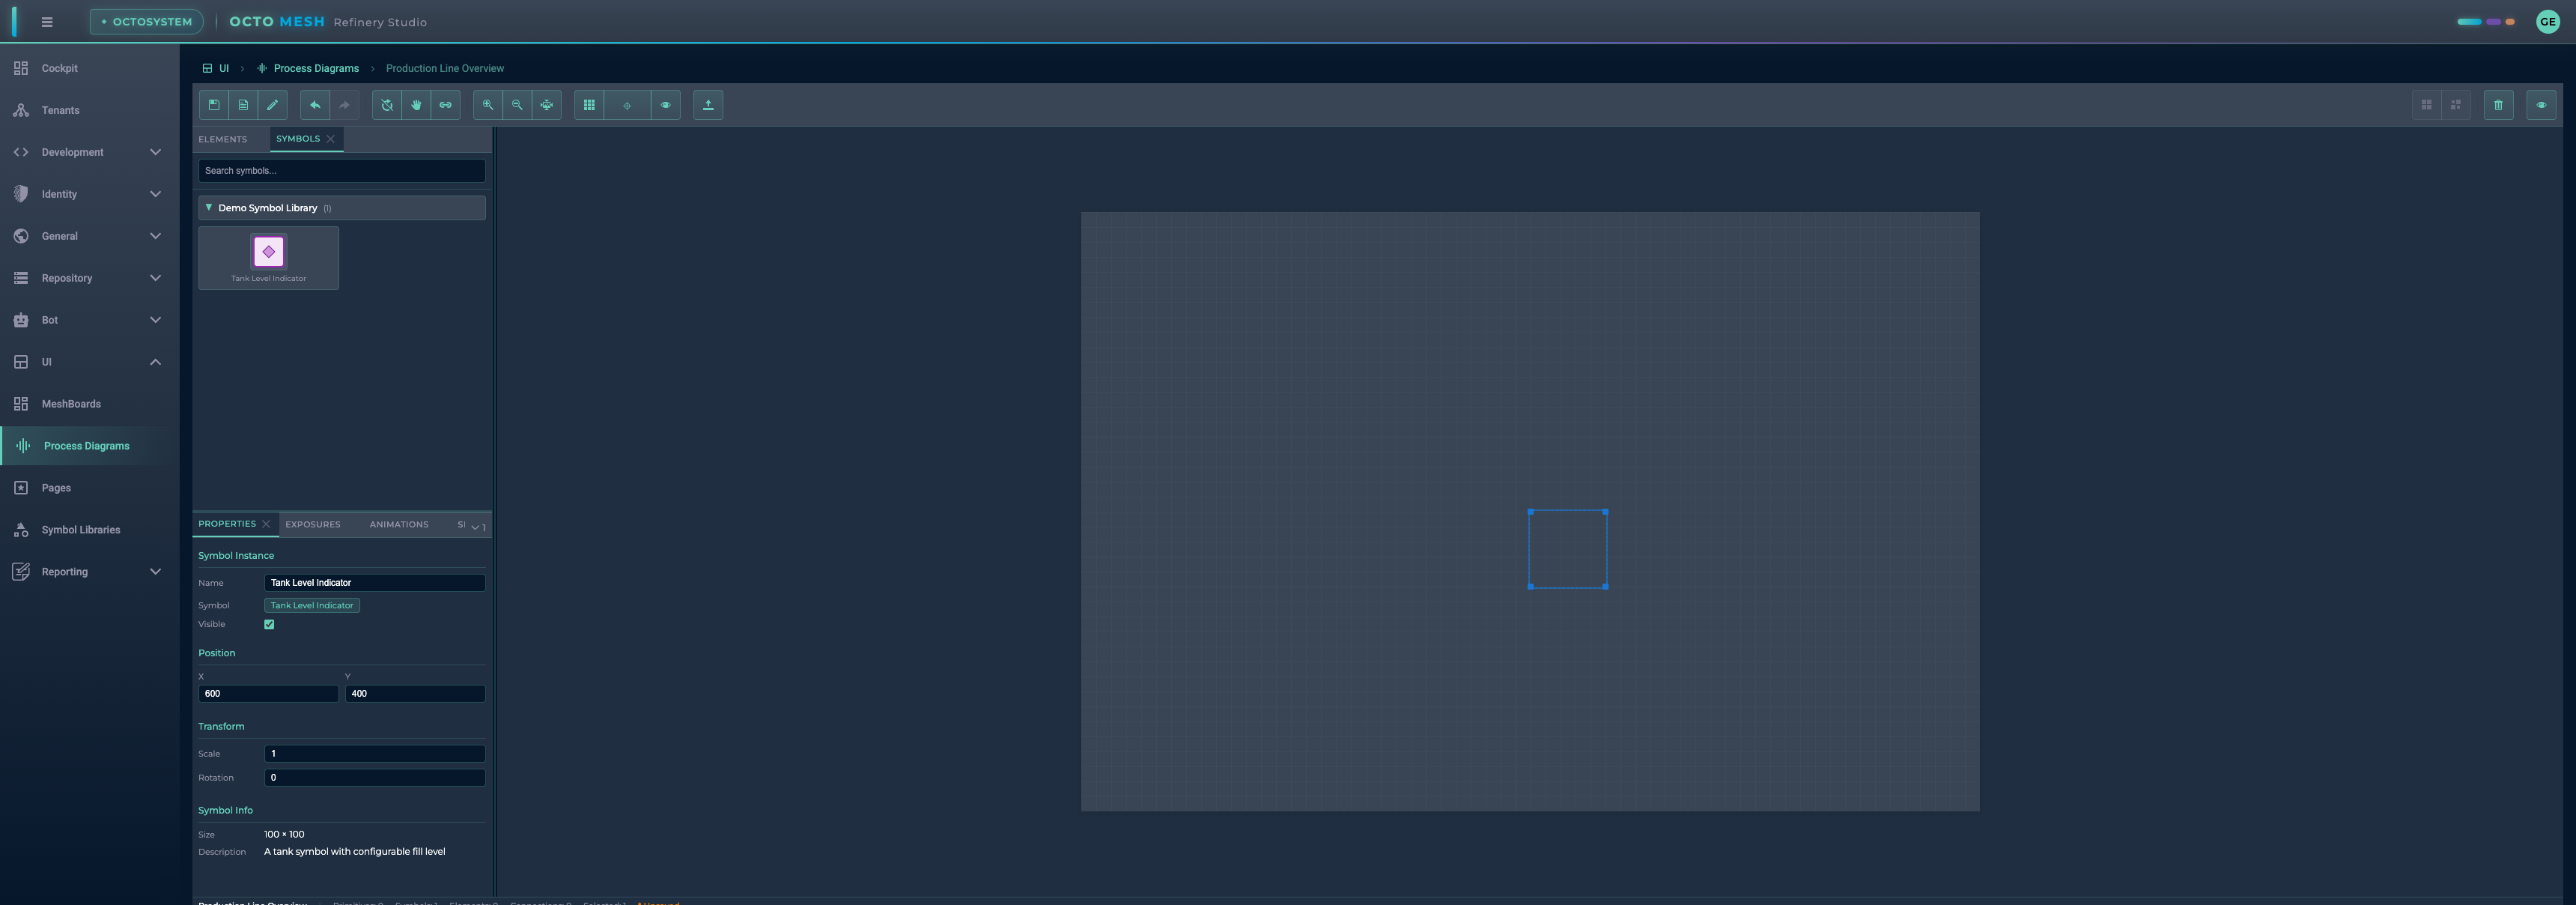
Symbol Instance:
- Name: Instance name (can differ from symbol name)
- Symbol: Source symbol reference
- Visible: Toggle visibility
Position:
- X/Y: Canvas position
Transform:
- Scale: Size multiplier
- Rotation: Rotation in degrees
Symbol Info:
- Size: Original symbol dimensions
- Description: Symbol description
EXPOSURES Tab
Define diagram-level transform properties that can control multiple elements.
ANIMATIONS Tab
Configure animations for diagram elements.
SIMULATION Tab
Test diagram properties with live previews.
Working with Symbols
Adding Symbols to a Diagram
- Open the SYMBOLS tab in the left panel
- Browse your symbol libraries
- Drag a symbol onto the canvas
- Position and resize as needed
Configuring Symbol Properties
When a symbol has exposed transform properties (like FillLevel), you can:
- Select the symbol instance
- View available properties in the Properties panel
- Set static values or bind to data sources
Connect Mode
Use Connect mode to create visual connections between elements:
- Click the Connect tool (C) or press
C - Click on a source element
- Click on a target element
- A connection line is created
Connections are useful for:
- Showing material flow between equipment
- Representing data flow
- Indicating relationships between components
Working with Multiple Elements

You can combine:
- Symbols: Reusable components from your libraries
- Primitives: Basic shapes for custom graphics
- Text: Labels and annotations
- Images: External graphics
The status bar shows counts:
- Primitives: Number of basic shapes
- Symbols: Number of symbol instances
- Elements: Total element count
- Connections: Number of connections
- Selected: Currently selected items
Toolbar Tools
Select Tool (V)
The default tool for:
- Selecting elements (click)
- Multi-selecting (Ctrl+click or drag selection box)
- Moving elements (drag)
- Resizing elements (drag handles)
Pan Tool (H)
Navigate the canvas:
- Click and drag to pan the view
- Useful for large diagrams
Connect Tool (C)
Create connections:
- Click source element
- Click target element
- Connection is created
Saving and Managing Diagrams
Save Options
- Save (Ctrl+S): Save current changes
- Save As...: Create a copy with a new name
- Rename...: Change the diagram name
Unsaved Changes
An asterisk (*) next to the diagram name indicates unsaved changes. You'll be prompted to save when navigating away.
Keyboard Shortcuts
| Shortcut | Action |
|---|---|
| Ctrl+S | Save diagram |
| Ctrl+Z | Undo |
| Ctrl+Y / Ctrl+Shift+Z | Redo |
| Ctrl+C | Copy selected |
| Ctrl+V | Paste |
| Ctrl+D | Duplicate |
| Delete | Delete selected |
| Ctrl+G | Group selected |
| Ctrl+Shift+G | Ungroup |
| Ctrl+A | Select all |
| Escape | Deselect / Cancel |
| V | Select tool |
| H | Pan tool |
| C | Connect tool |
| Arrow Keys | Move selected |
| Shift+Arrow Keys | Move 10px |
Differences from Symbol Designer
| Feature | Symbol Designer | Process Diagram Editor |
|---|---|---|
| Purpose | Create reusable symbols | Build complete visualizations |
| Symbol Libraries | Define symbols | Use symbols |
| Transform Properties | Define exposed properties | Bind to data or set values |
| Canvas Size | Fixed per symbol | Configurable per diagram |
| Connections | Connection points | Full connections |
| File Operations | Part of library | Save/Save As/Rename |
Best Practices
- Use symbols for repeated elements: Create symbols in libraries and reuse them across diagrams
- Organize with layers: Use grouping to organize complex diagrams
- Name your elements: Give meaningful names for easier maintenance
- Use grid snapping: Enable snap-to-grid for aligned layouts
- Save frequently: Use Ctrl+S to save your work regularly
- Test with simulation: Use the Simulation panel to verify property bindings
Integration with OctoMesh Data
Process diagrams can be connected to live OctoMesh data:
- Symbol properties: Bind to runtime entity attributes
- Dynamic updates: Symbols update as data changes
- Interactive elements: Click handlers for navigation or actions
This enables real-time visualization of:
- Equipment status
- Process values (temperatures, pressures, levels)
- Alarm states
- Production metrics