Power BI Service (Cloud)
This guide covers publishing reports to Power BI Service and configuring scheduled data refresh.
Prerequisites
Before publishing to Power BI Service:
- Report created in Power BI Desktop using the OctoMesh Connector
- Gateway configured with the OctoMesh Connector installed (see Gateway Setup)
- Connection created in Power BI Service (see Gateway Setup - Step 4)
Publishing from Power BI Desktop
- Open your report in Power BI Desktop.
- Click Publish in the Home ribbon.
- Select a workspace in Power BI Service.
- Wait for the publishing to complete.
- Click the link to open the report in Power BI Service.
Connecting the Semantic Model to the Gateway
After publishing, you need to connect the Semantic Model (formerly Dataset) to your Gateway:
- Open Power BI Service.
- Navigate to your Workspace.
- Find the published Semantic Model (same name as your report).
- Click the three dots (...) next to the Semantic Model → Settings.
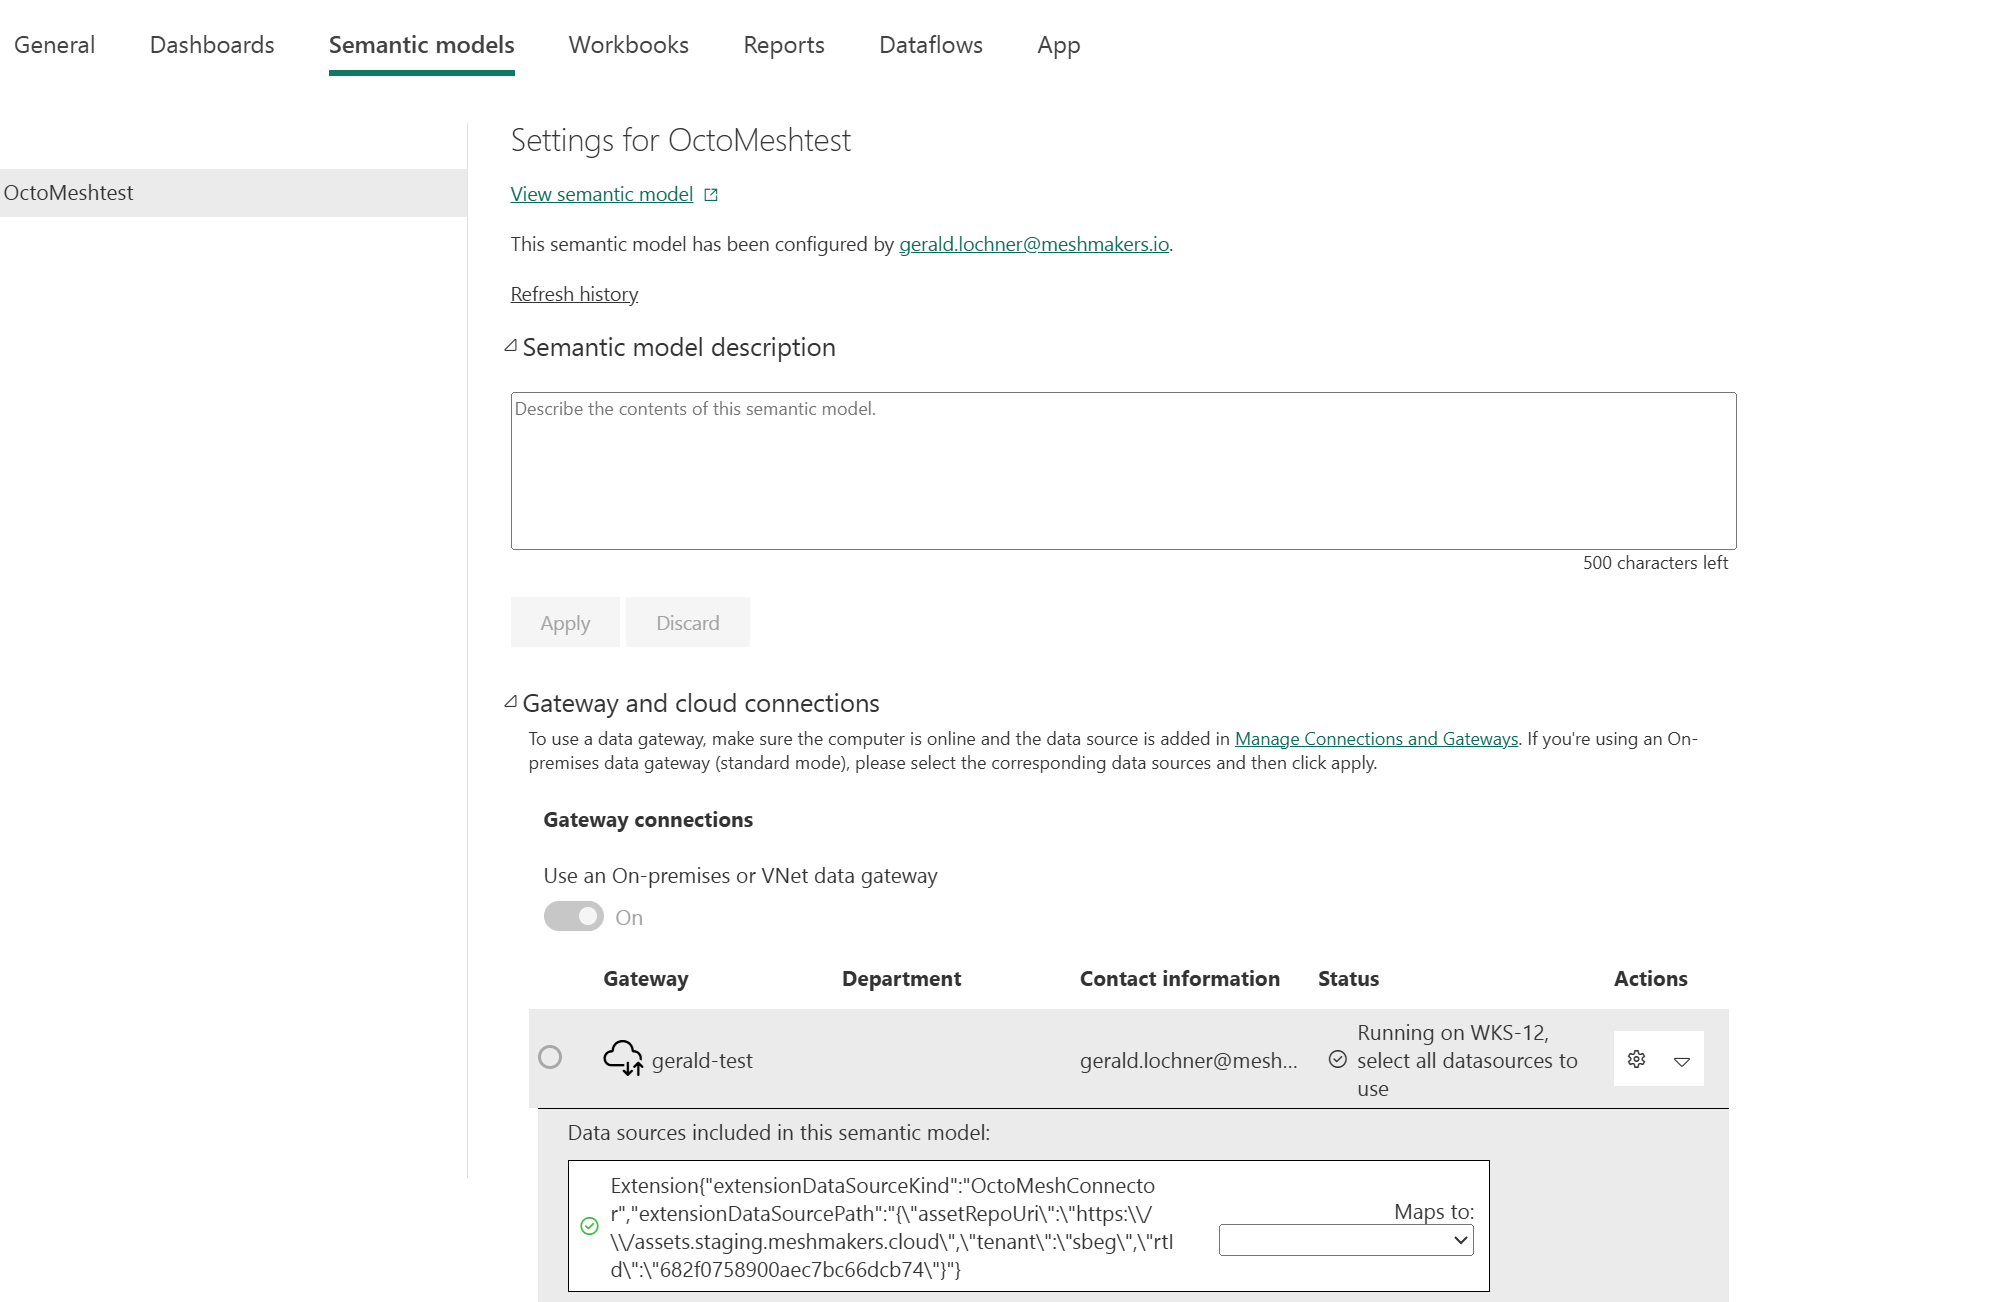
- Expand Gateway and cloud connections.
- Enable Use an On-premises or VNet data gateway.
- Select your Gateway from the dropdown.
- Under Data sources included in this semantic model, find the OctoMesh data source.
- In the Maps to dropdown, select the connection you created earlier.
- Click Apply.
Configuring Scheduled Refresh
Once the Gateway connection is configured:
- In the Semantic Model settings, expand Refresh.
- Enable Scheduled refresh.
- Set your desired refresh frequency and time.
- Click Apply.
tip
For production scenarios, schedule refreshes during off-peak hours to minimize load on both the Gateway and OctoMesh services.
Manual Refresh
To manually refresh the data:
- Navigate to your Workspace.
- Find the Semantic Model.
- Click the Refresh icon, or click the three dots → Refresh now.
Viewing Refresh History
To check the status of past refreshes:
- Open the Semantic Model settings.
- Expand Refresh.
- Click Refresh history.
This shows:
- Start and end times
- Duration
- Status (Success/Failed)
- Error messages (if any)
Next Steps
- Troubleshooting - Common issues and solutions
- Gateway Setup - If you need to configure additional connections