Query Builder
The Query Builder in OctoMesh Refinery Studio allows you to create, save, and execute queries against your OctoMesh Runtime entities. It provides a visual interface for building queries without writing GraphQL code directly.
Accessing Query Builder
Navigate to Repository > Query Builder to access the query management interface.
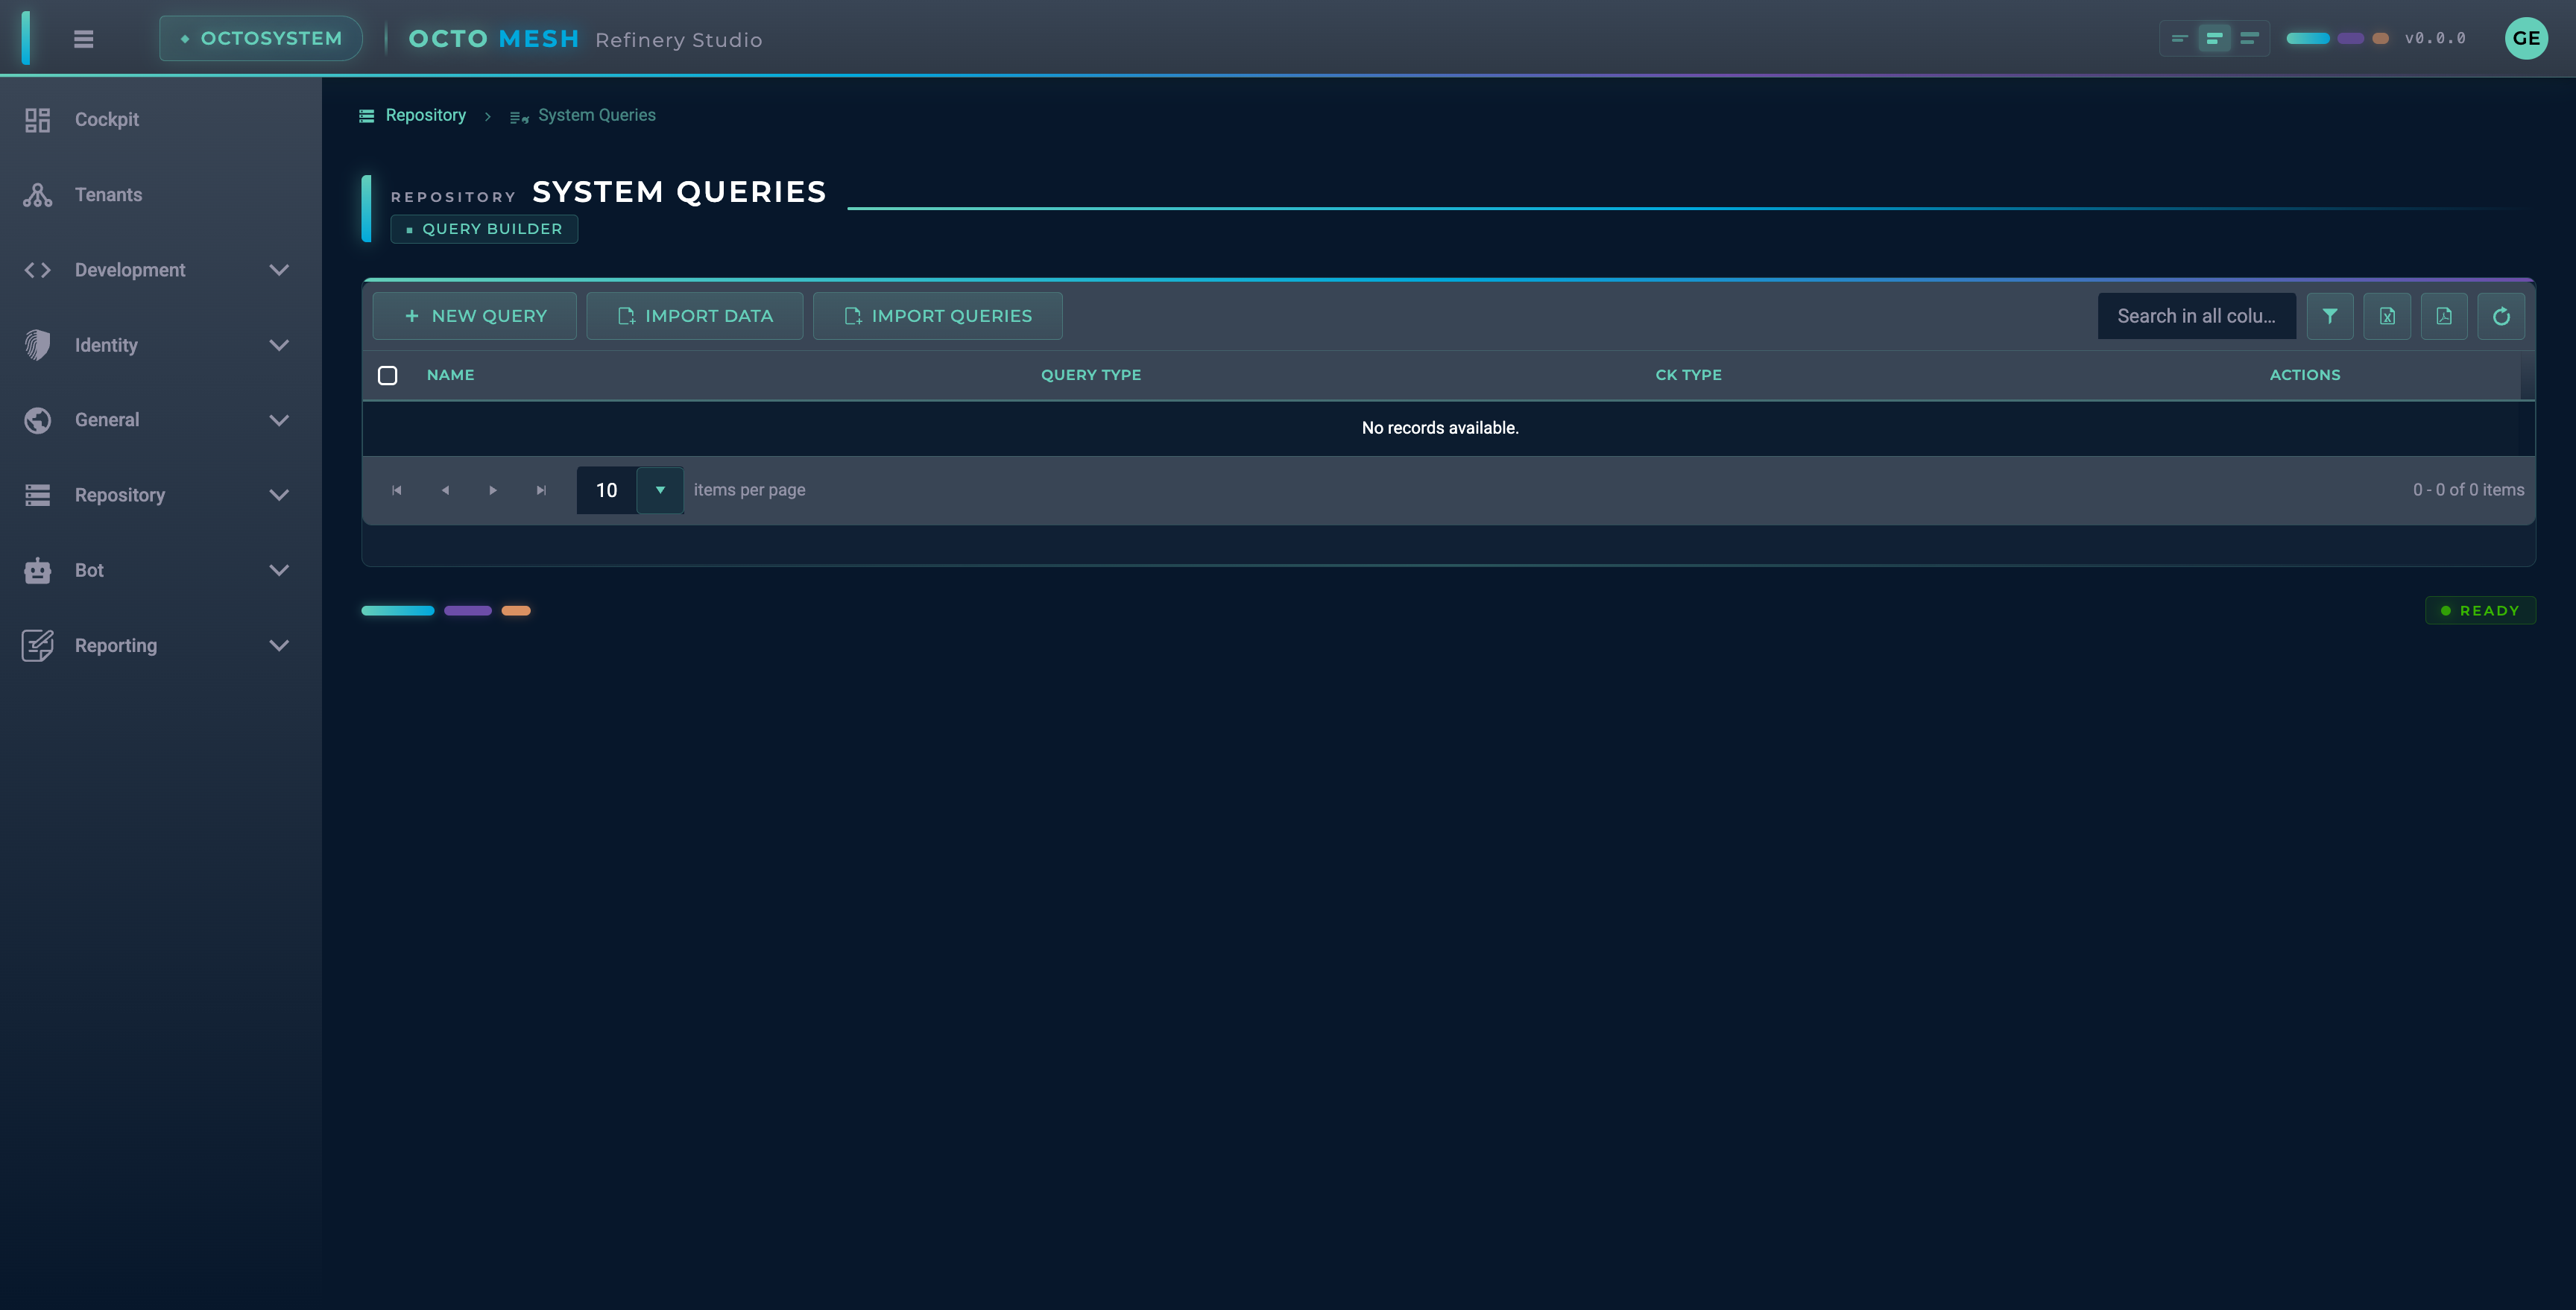
The list view shows all saved queries with their name, query type, and CK type. It provides actions to edit or delete them.
Toolbar Actions
| Button | Description |
|---|---|
| NEW QUERY | Create a new query |
| IMPORT DATA | Import data from a file |
| IMPORT QUERIES | Import query definitions from a file |
| Export to Excel | Export the query list to an Excel file |
| Export to PDF | Export the query list to a PDF file |
| Refresh Data | Reload the query list from the server |
Row Actions
Each query row provides the following action buttons:
| Action | Description |
|---|---|
| Run | Execute the query and view results |
| Edit | Open the query in the editor |
Context Menu
Right-clicking on a query row opens a context menu with additional actions:
| Action | Description |
|---|---|
| Duplicate | Create a copy of the query |
| Export Results | Execute the query and export results as a ZIP file |
| Export Query | Export the query definition as a ZIP file |
| Delete | Delete the query (with confirmation) |
Creating a New Query
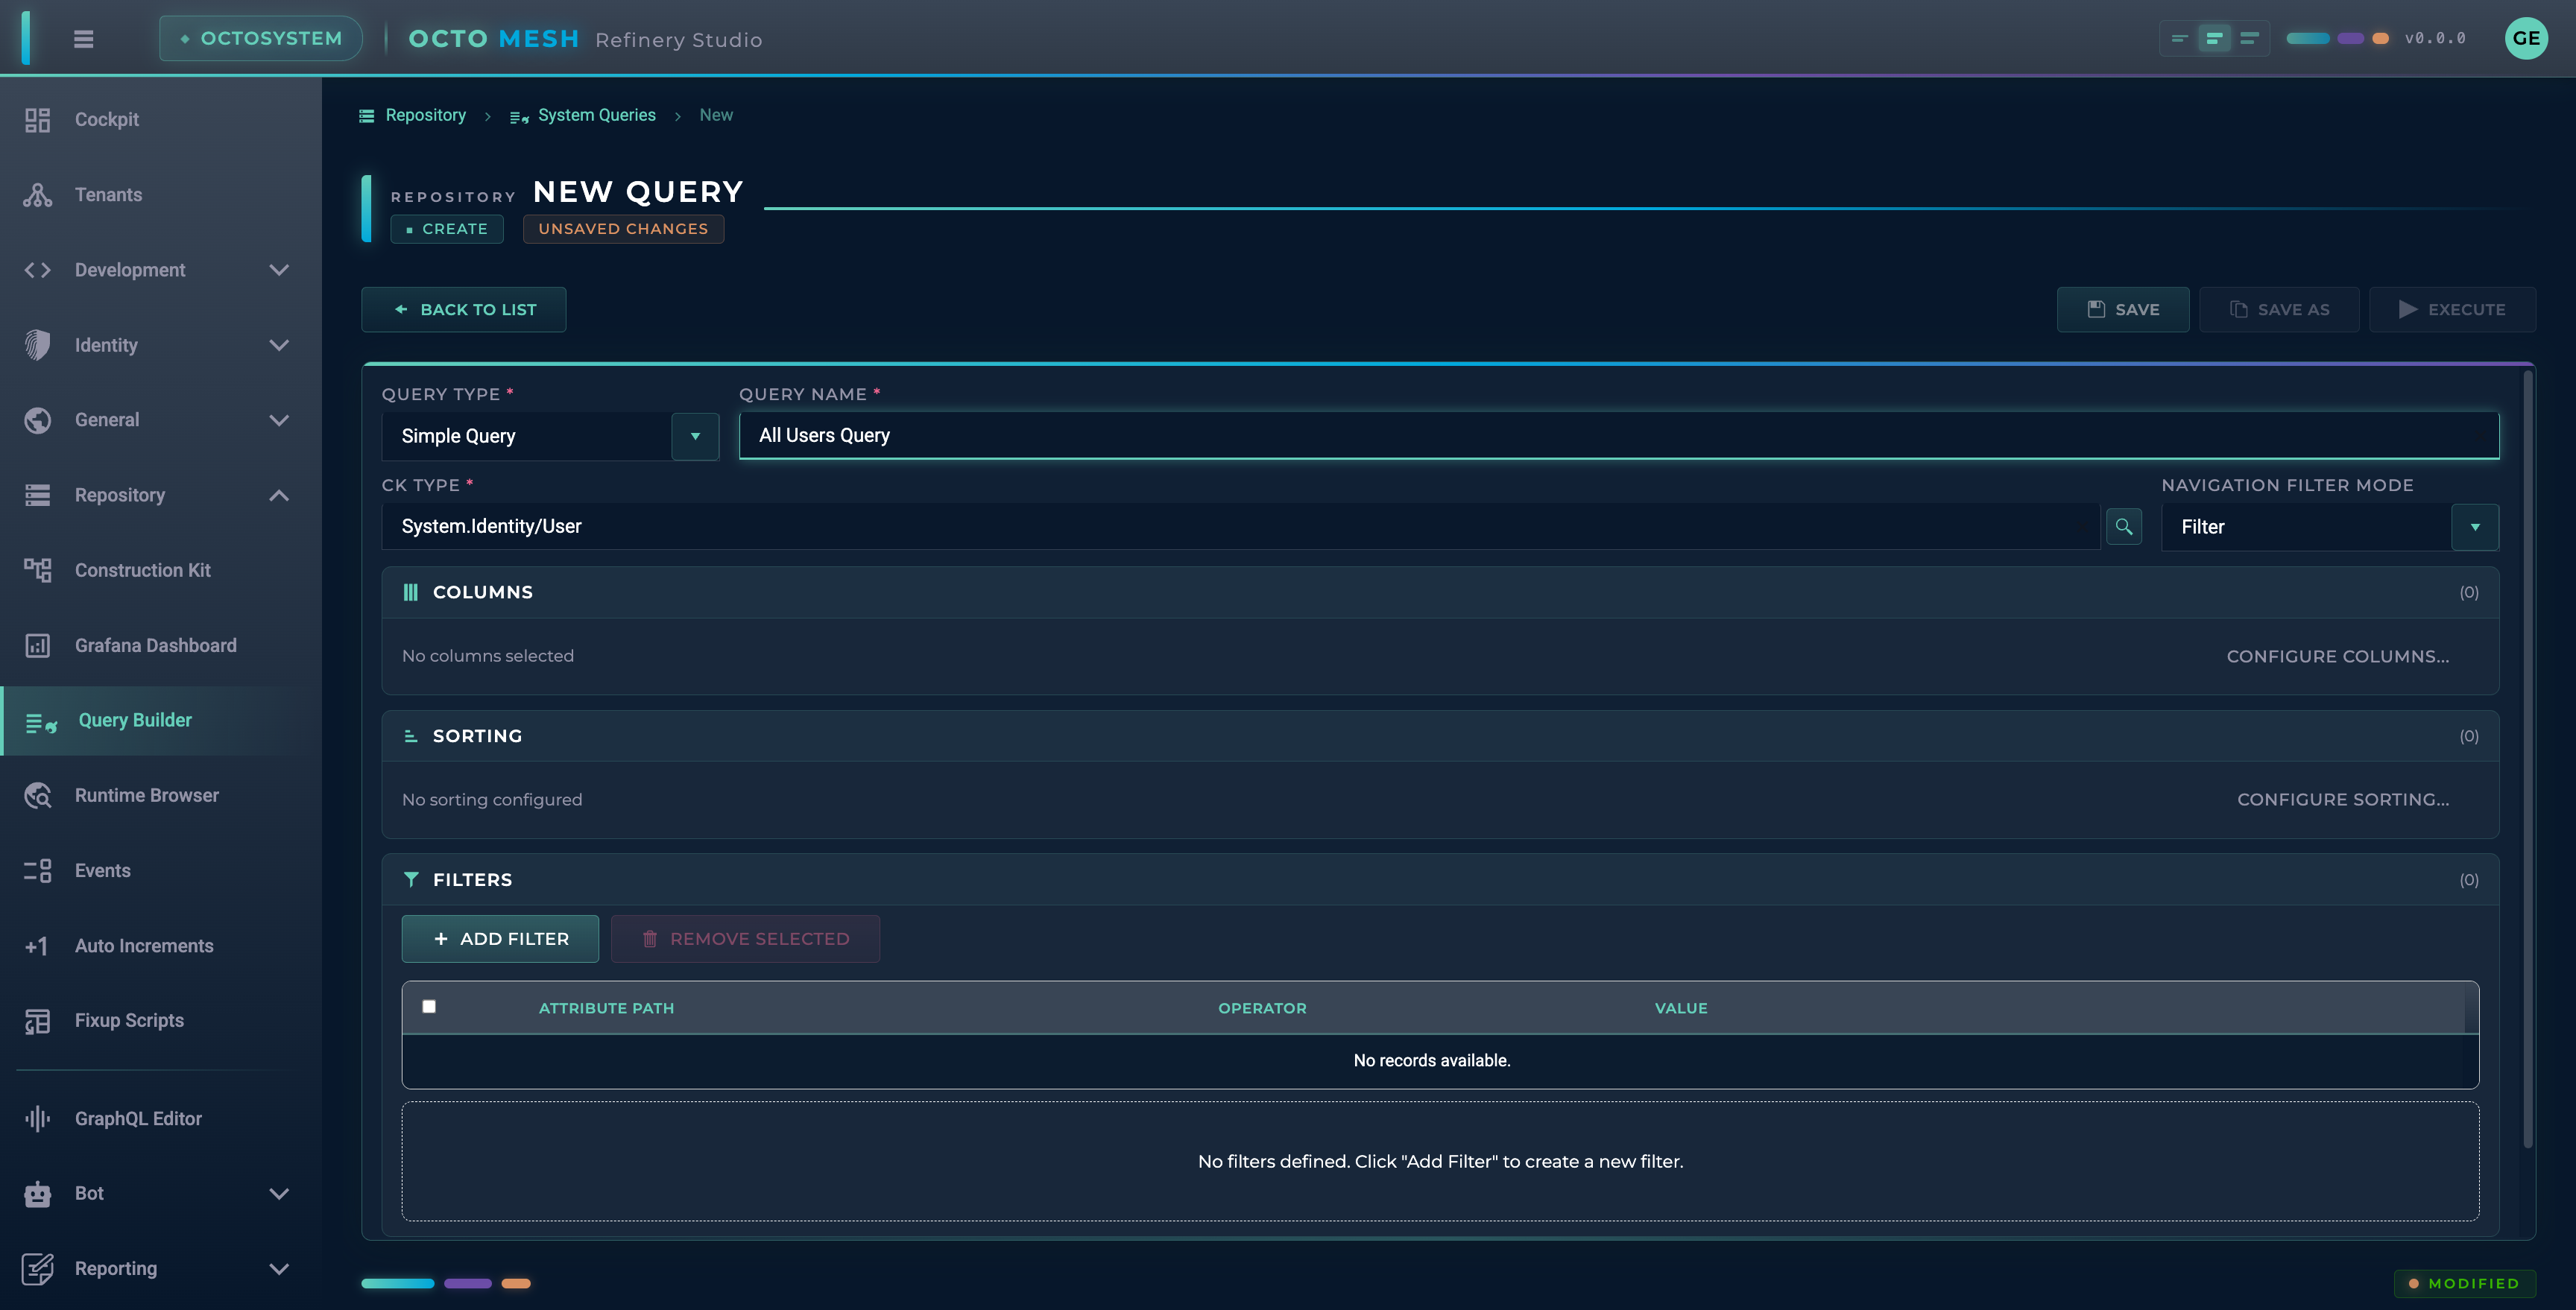
Click NEW QUERY to open the query configuration form.
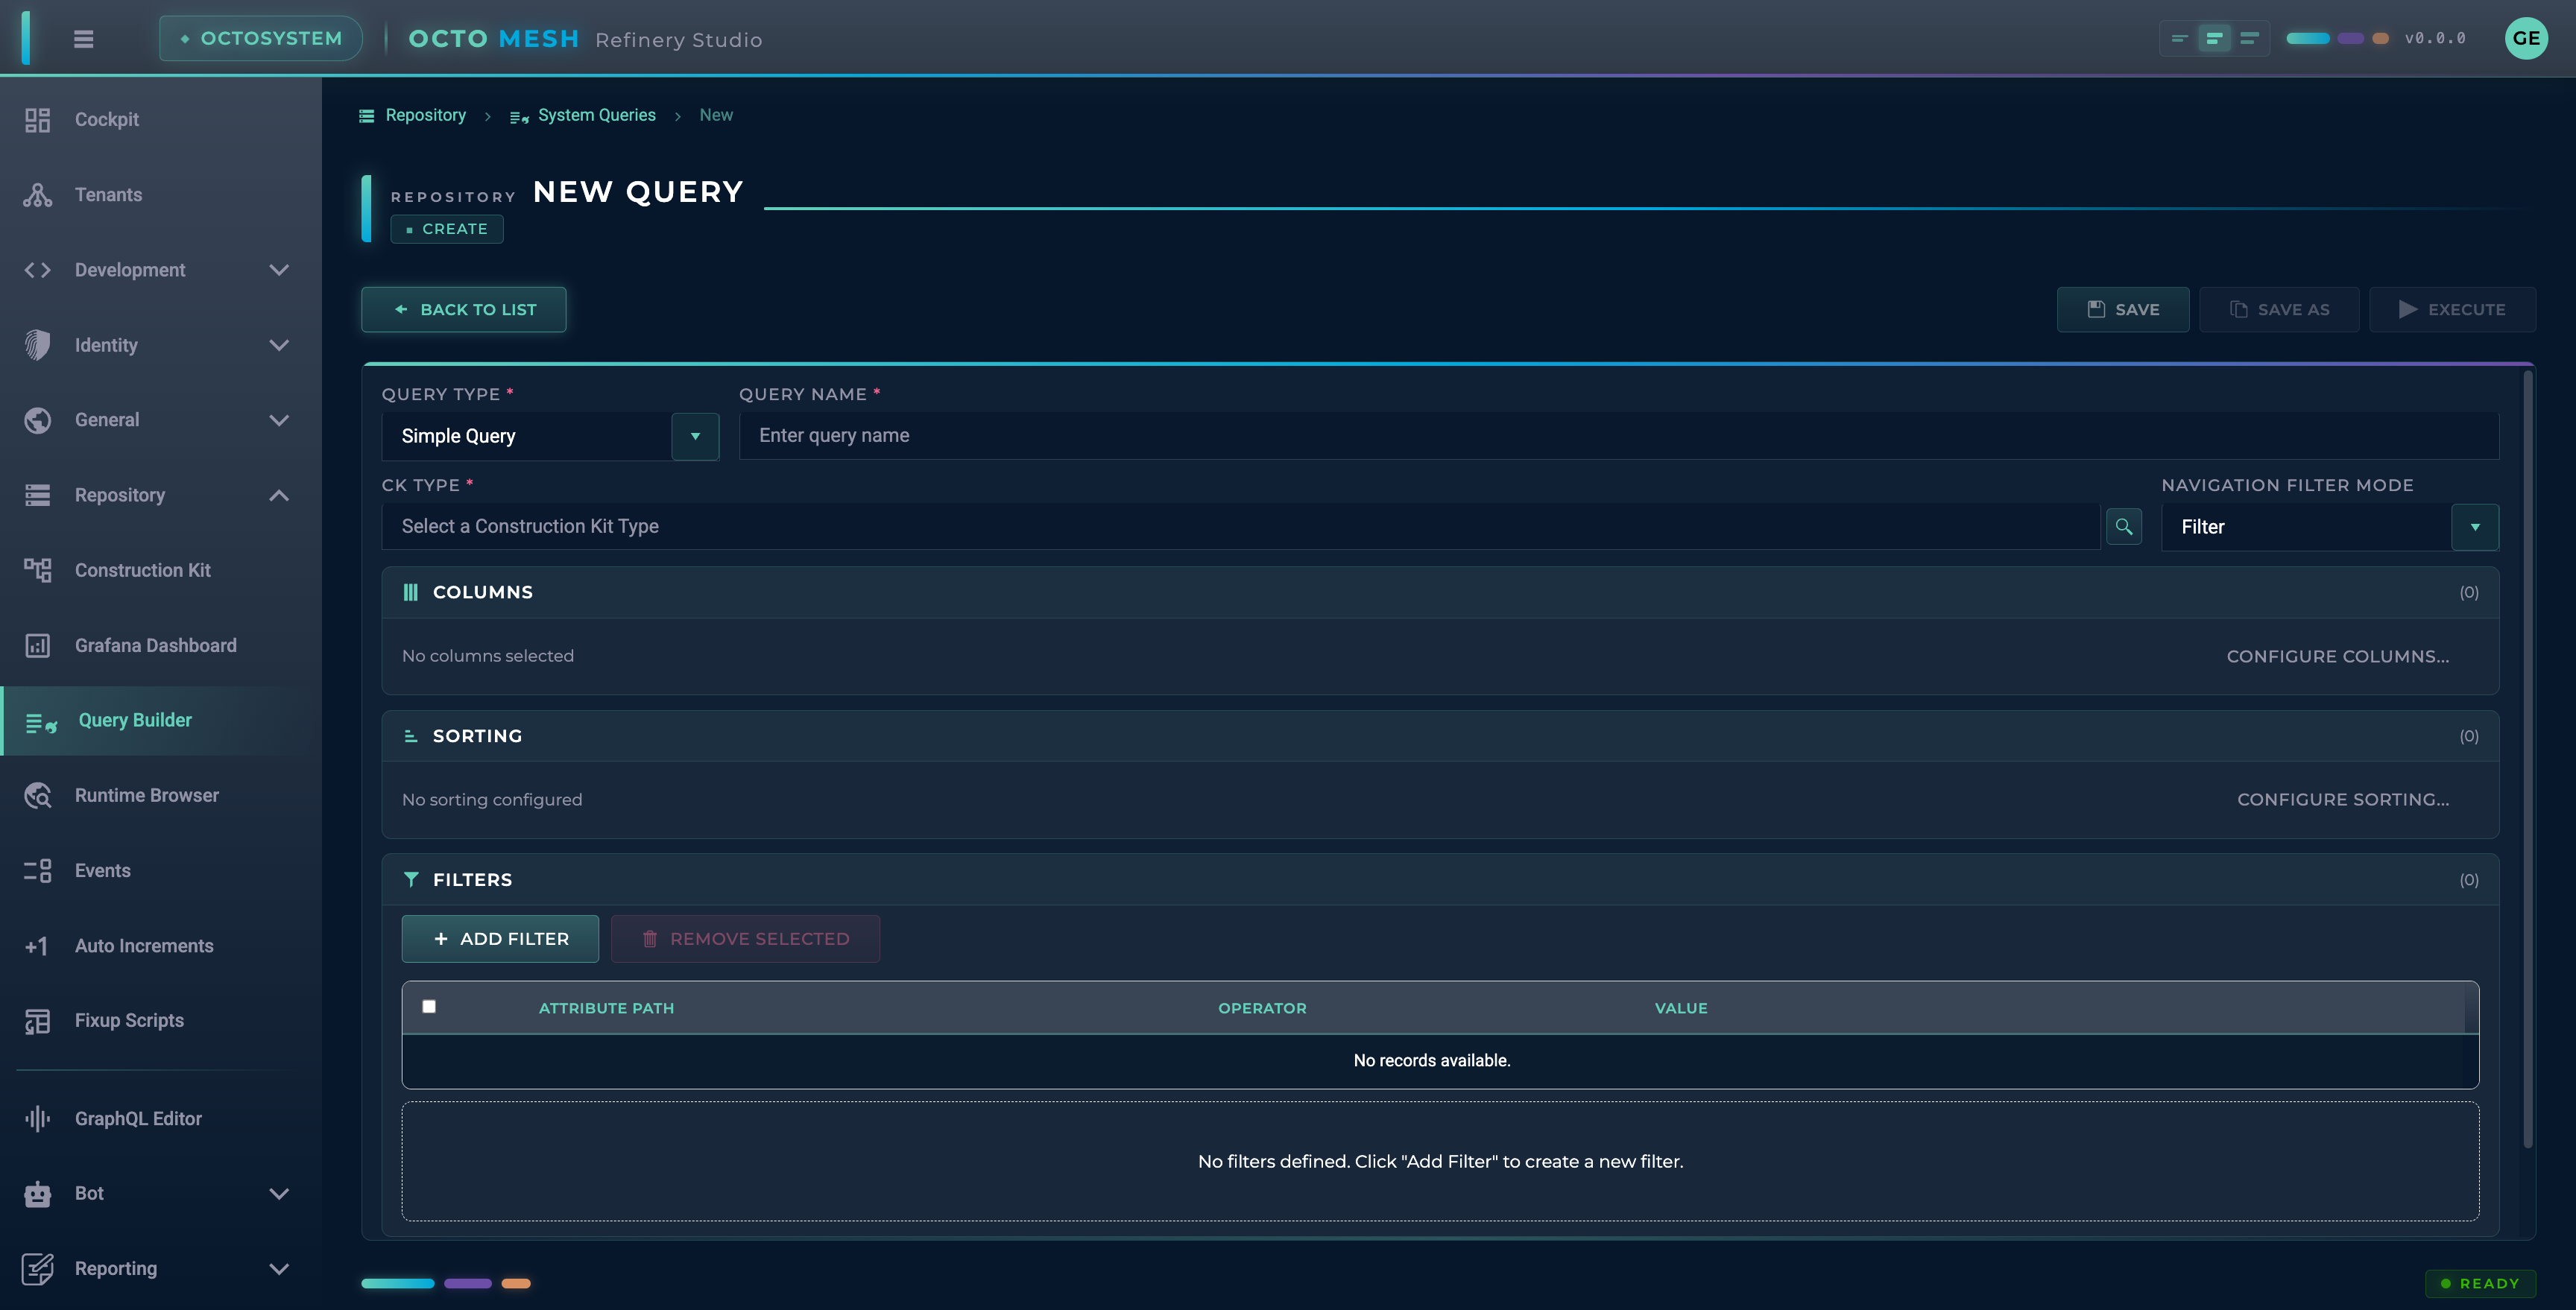
Query Configuration
The query form has several sections:
Basic Settings
The basic settings are arranged in two rows for a compact layout:
Row 1: Query Type and Name
| Field | Description |
|---|---|
| Query Type | Select the type of query (Simple, Aggregation, or Grouped Aggregation). Each option includes a short description. |
| Query Name | A descriptive name for your query |
Row 2: CK Type and Navigation Filter Mode
| Field | Description |
|---|---|
| CK Type | The Construction Kit type to query |
| Navigation Filter Mode | Controls how entities without matching navigation associations are handled (see below) |
Navigation Filter Mode
The Navigation Filter Mode determines how entities are treated when they have no matching navigation associations:
| Mode | Description |
|---|---|
| Filter | Entities without matching navigation associations are excluded from the result set. |
| Include | Entities without matching navigation associations are kept with null values. |
Query Types
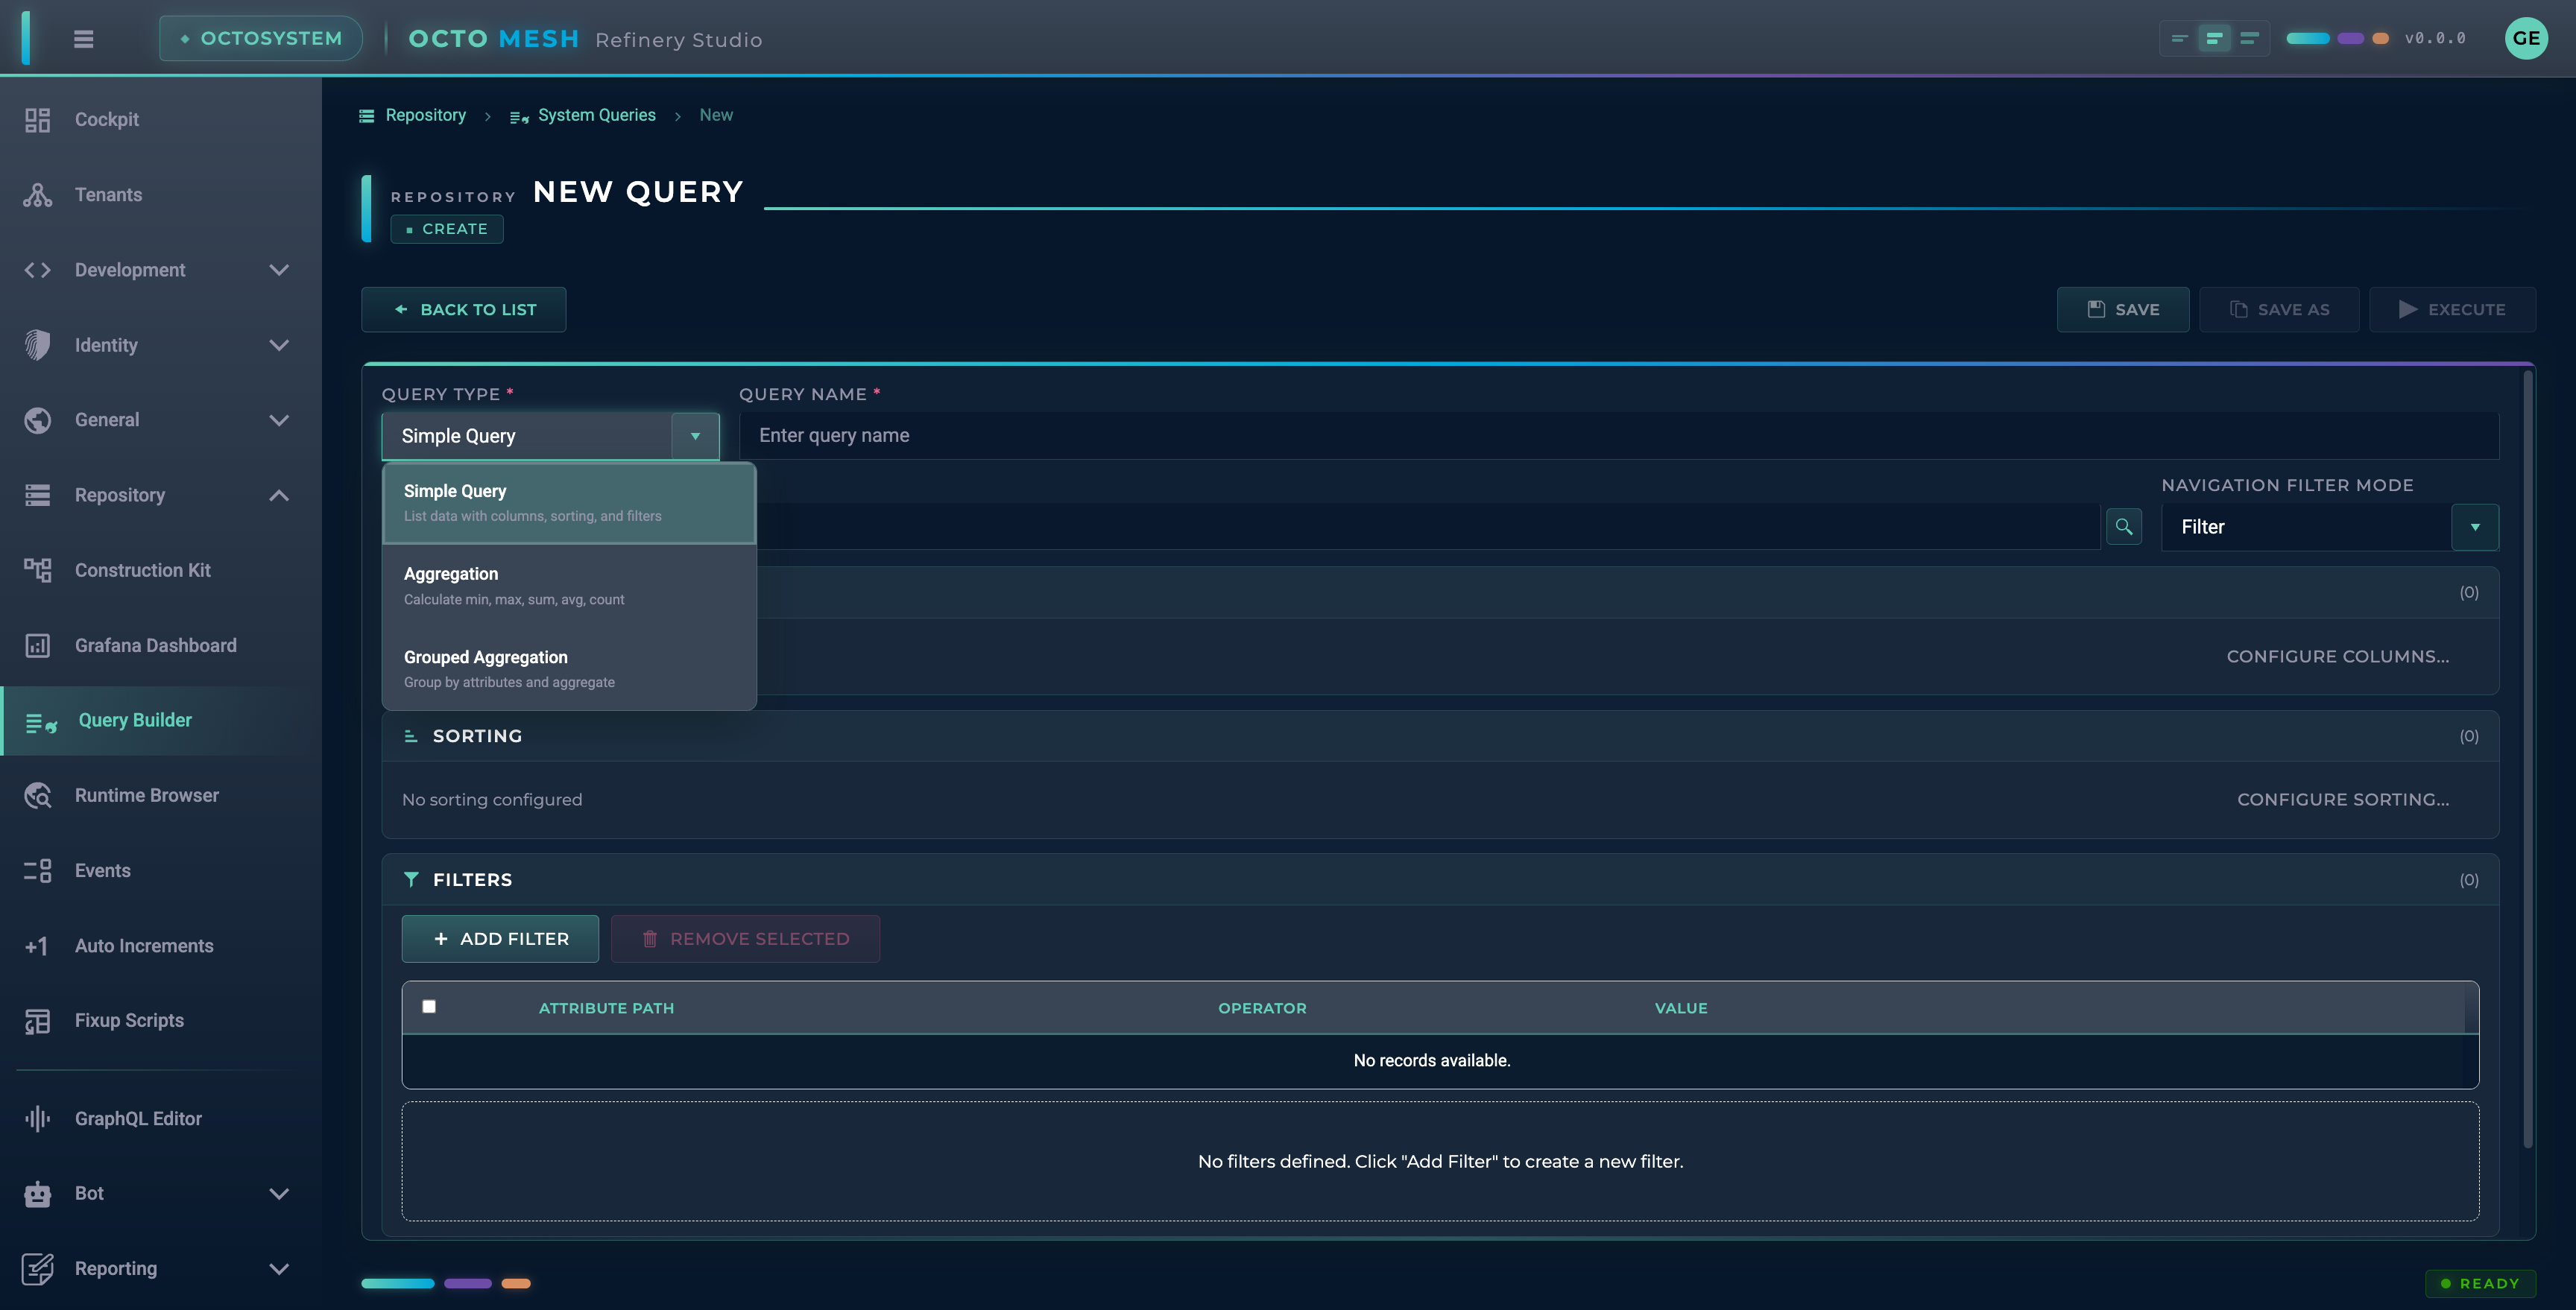
| Type | Description |
|---|---|
| Simple Query | Returns a list of entities with selected attributes |
| Aggregation | Performs aggregate calculations (COUNT, SUM, AVG, MIN, MAX) on all matching entities |
| Grouped Aggregation | Groups entities by an attribute and performs aggregate calculations per group |
Selecting a CK Type
Click the SELECT button next to the CK Type field to open the type selector.
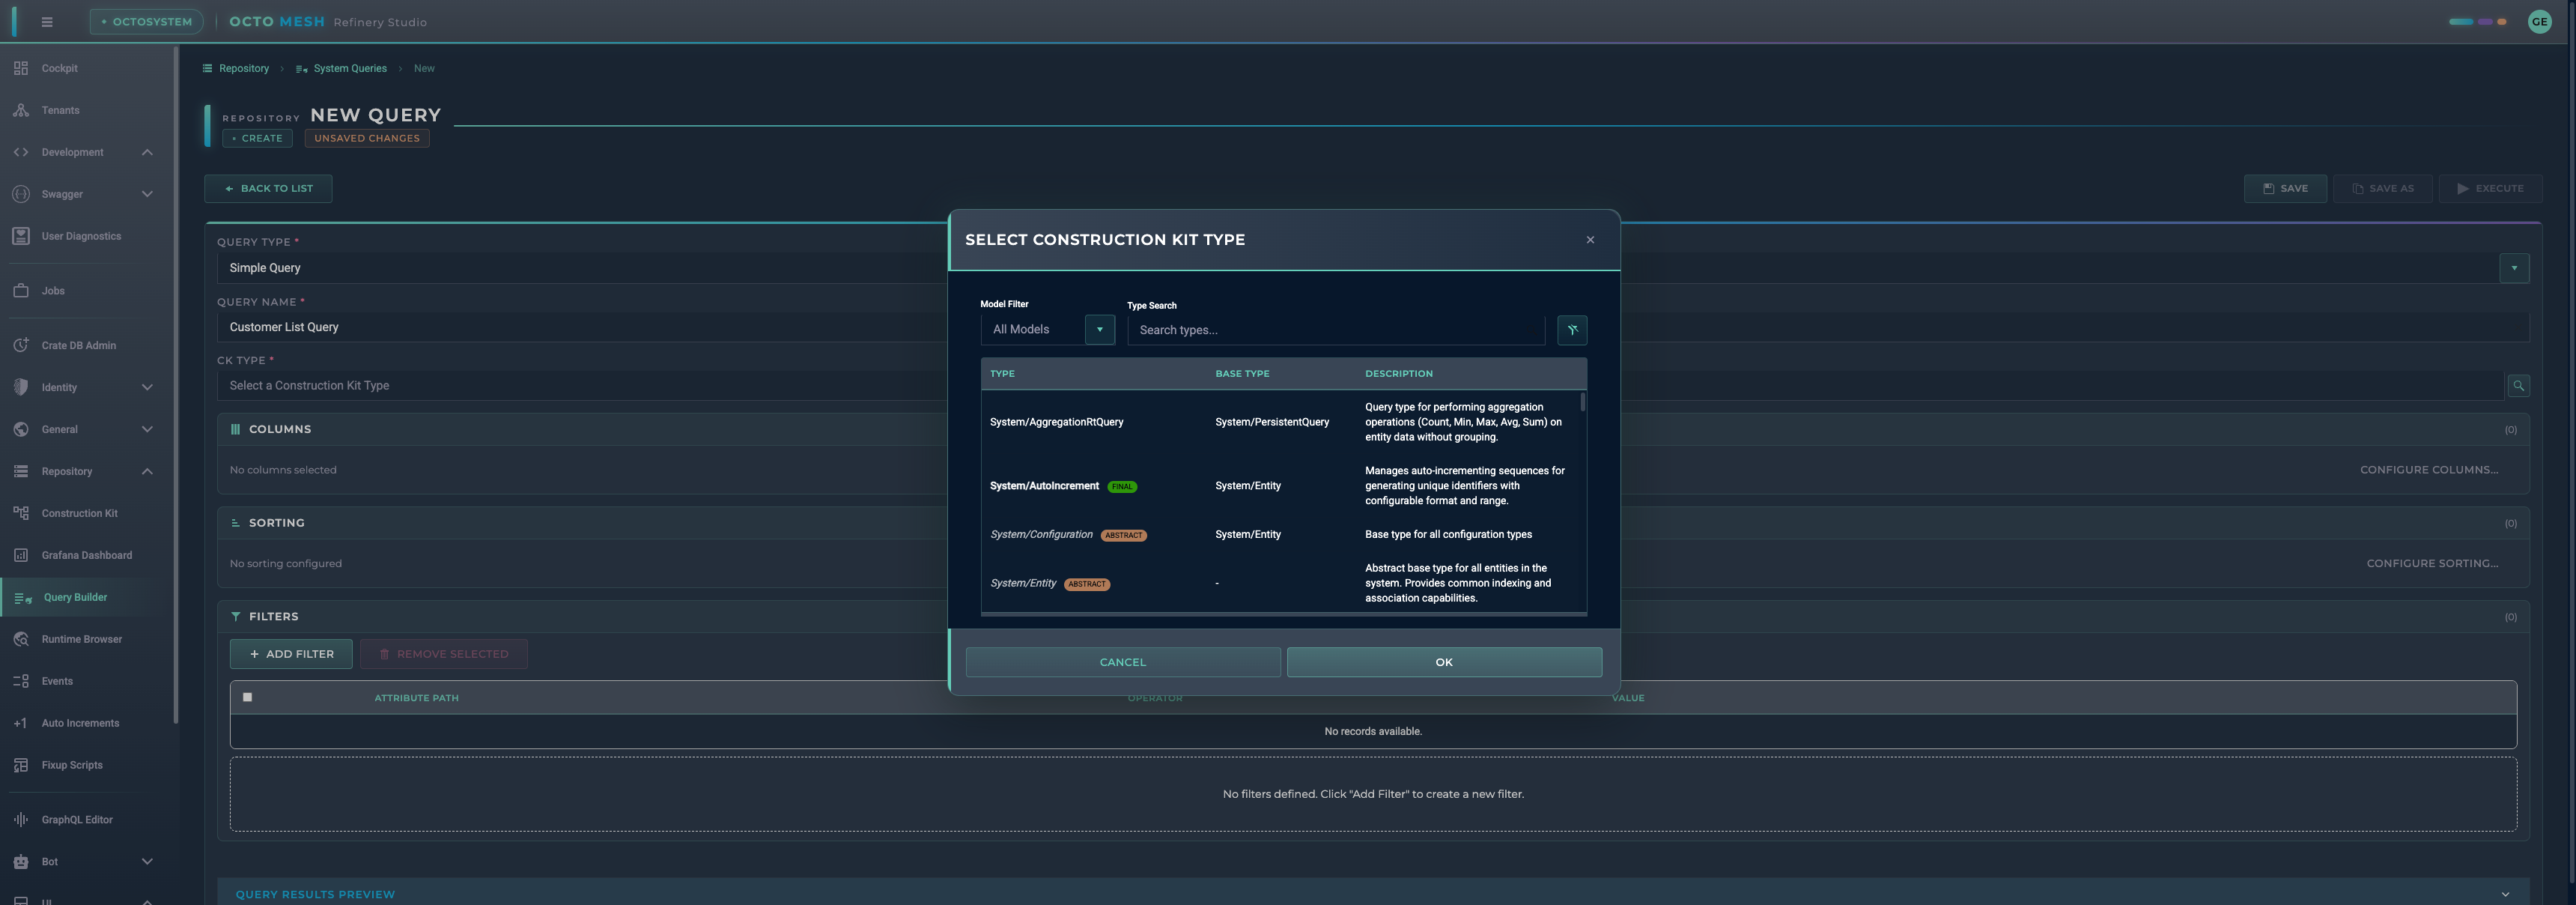
The selector dialog shows all available Construction Kit types organized by package. Use the search field to filter types by name. Click on a type to select it.
After selection, the CK Type field shows the selected type (e.g., System.Identity/User).
Simple Query Configuration
For Simple Queries, you configure columns, sorting, and filters.
Columns
Click ADD COLUMNS to select which attributes to include in query results.
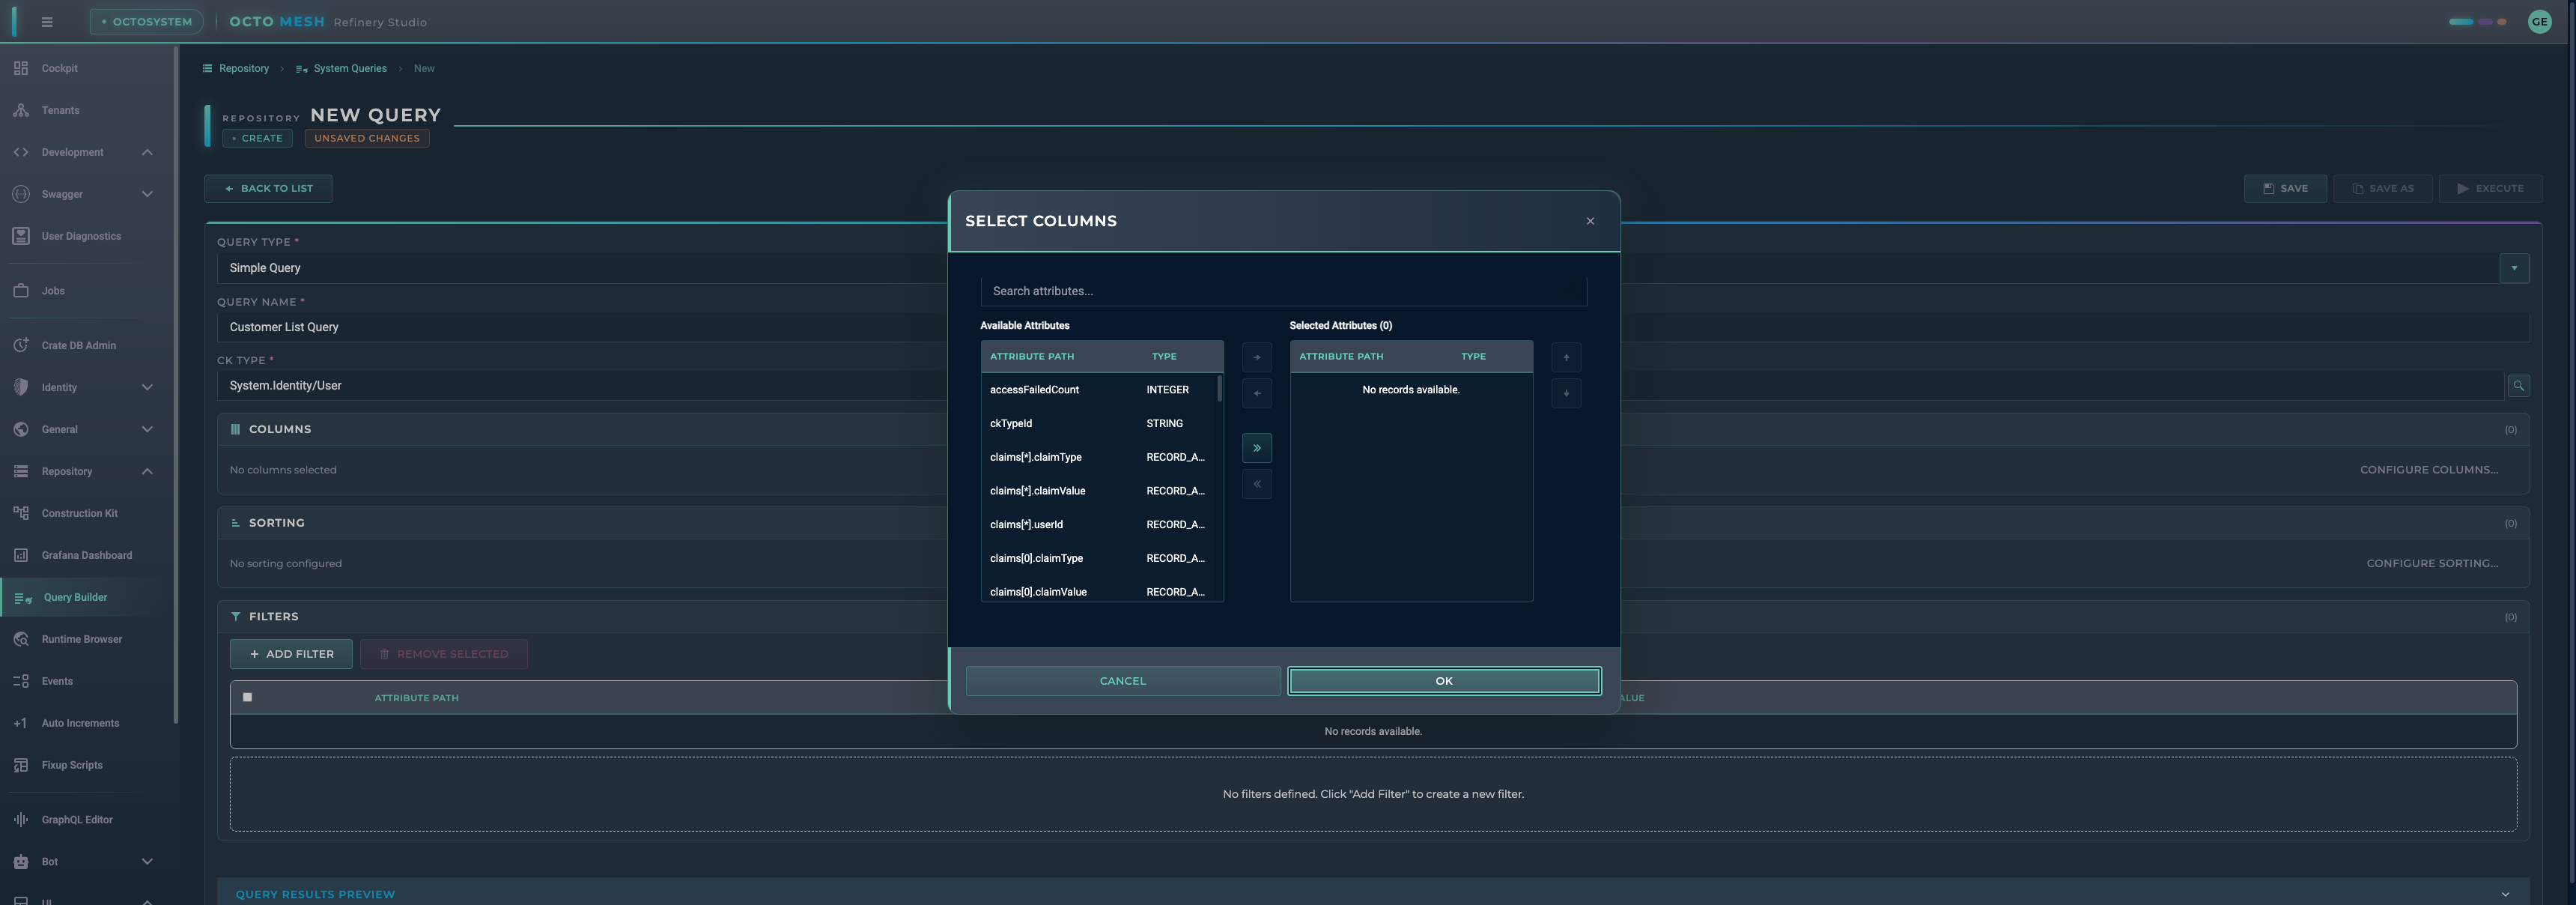
The column selection dialog shows:
- Available attributes (left panel): All attributes from the selected CK Type with their data types
- Selected columns (right panel): Attributes included in query results
Attribute types displayed include:
STRING- Text valuesINTEGER- Whole numbersINTEGER_64- Large whole numbersBOOLEAN- True/false valuesDATE_TIME- Date and time valuesDATE_TIME_OFFSET- Date and time with timezoneSTRING_ARRAY- List of text valuesRECORD_ARRAY- List of complex records
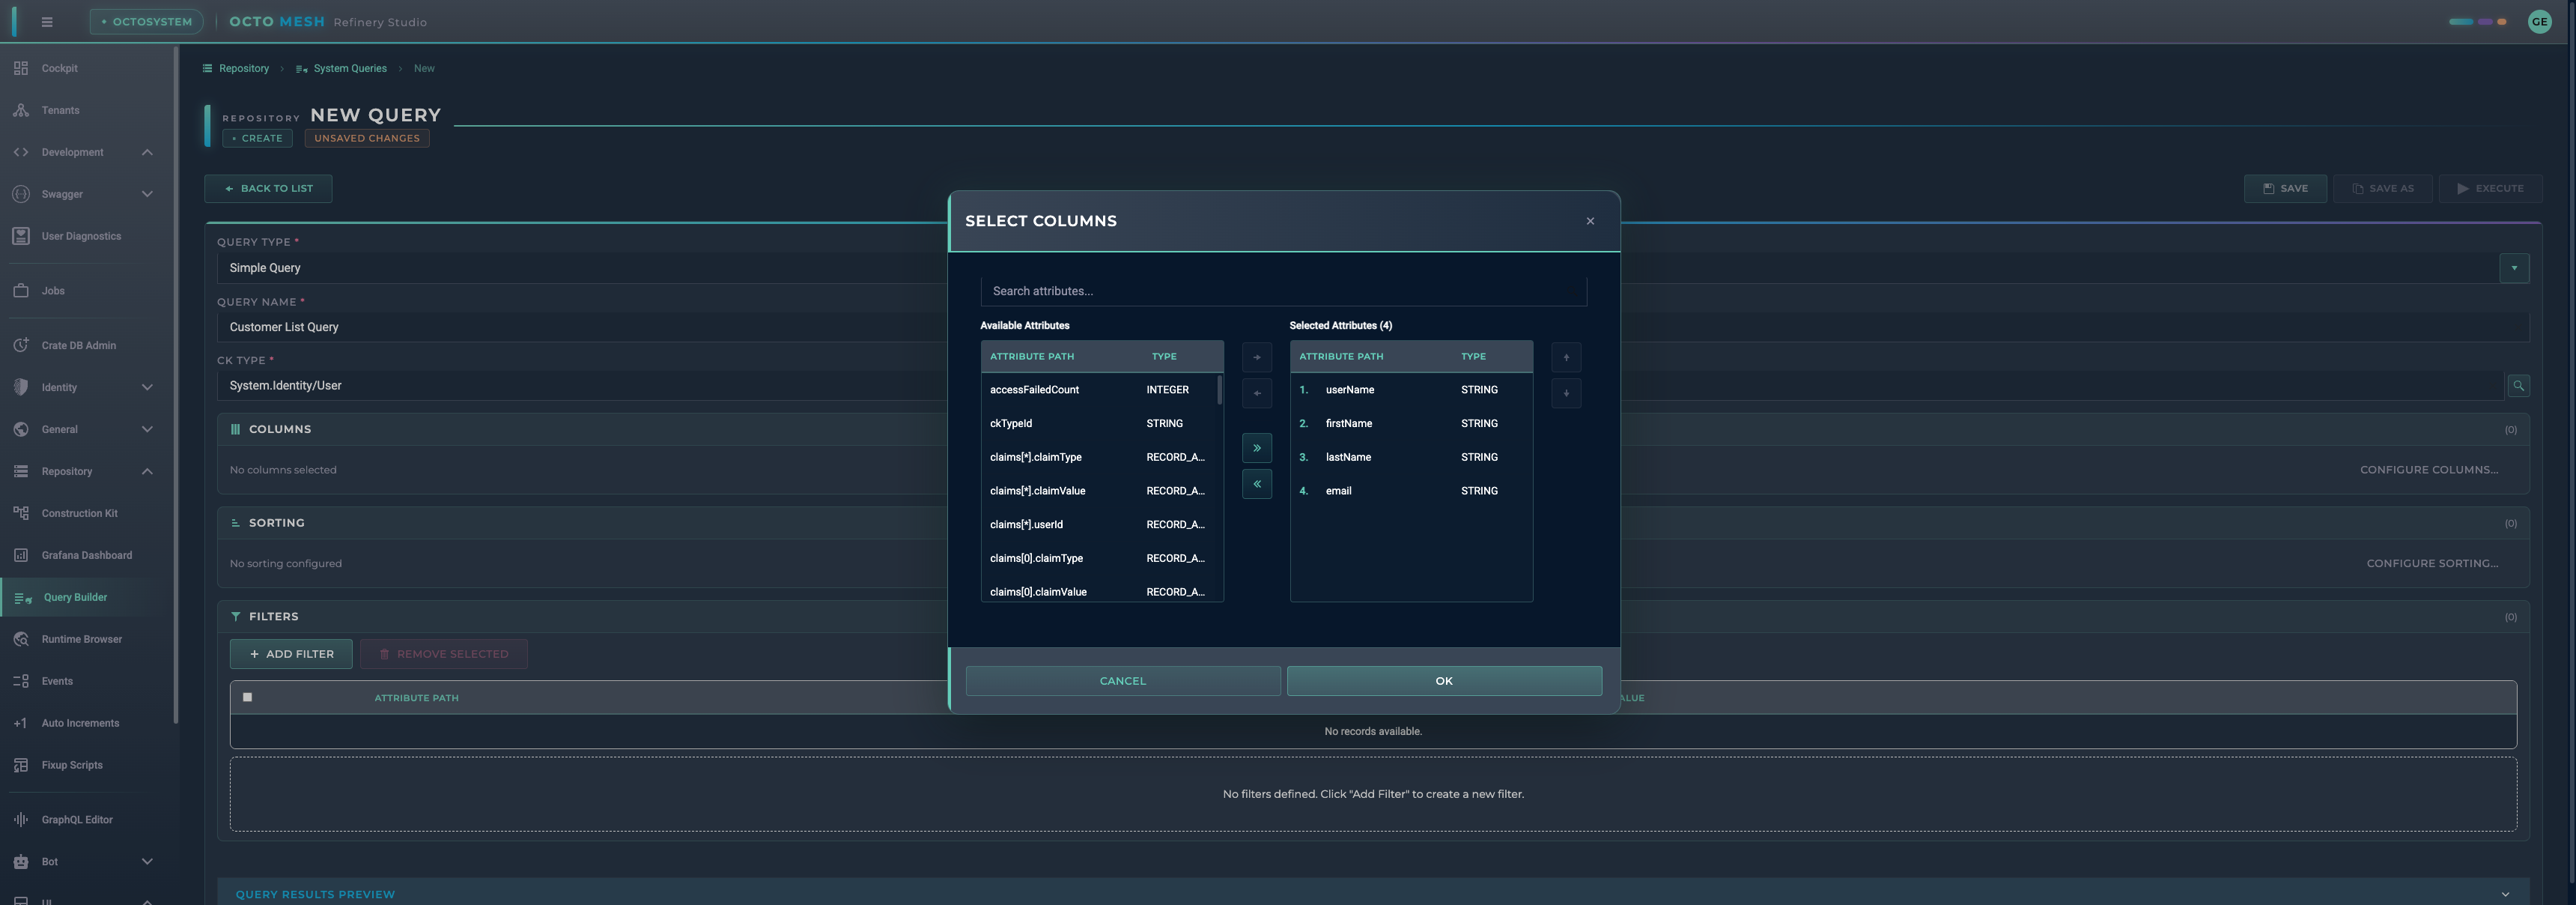
Use the arrow buttons to:
- Add selected attributes to the query
- Remove attributes from the query
- Reorder columns (move up/down)
Sorting
Add sorting rules to control the order of results:
- Click ADD SORTING
- Select the attribute to sort by
- Choose ascending or descending order
Multiple sort rules are applied in order.
Configured Query
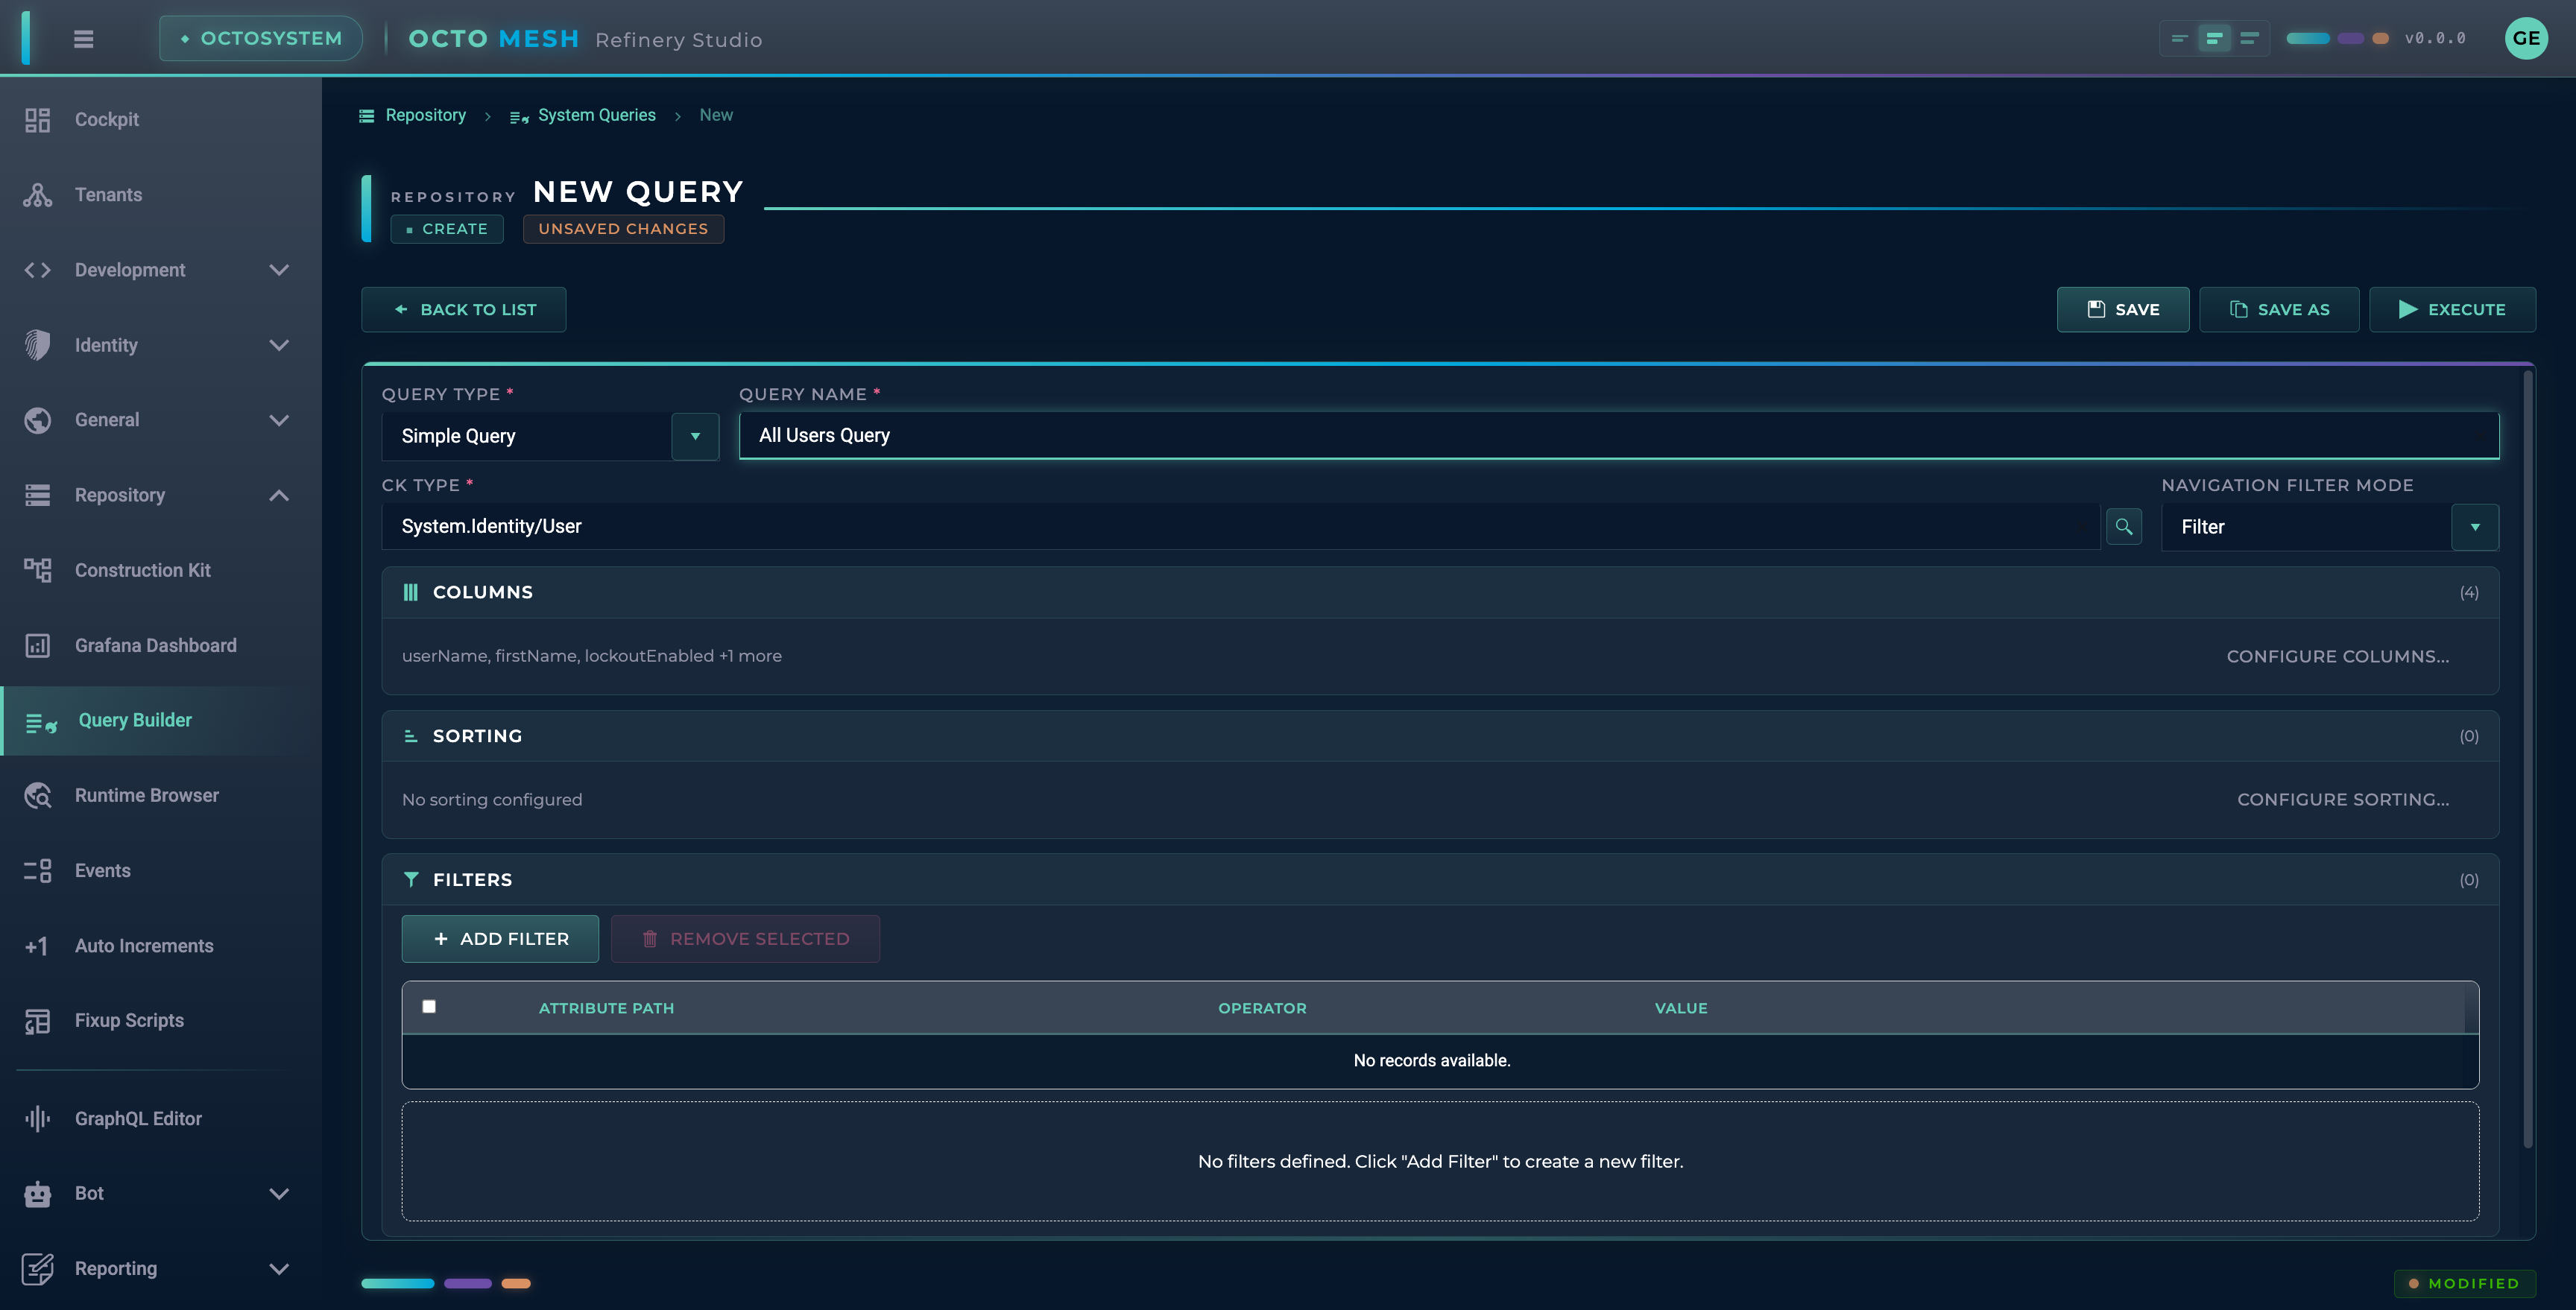
Once columns are configured:
- The SAVE button becomes enabled
- The EXECUTE button becomes enabled
- Column count is displayed (e.g., "4 Columns Selected")
Filters
Filters narrow down the query results based on attribute values.
Adding Filters
Click ADD FILTER to add a filter row.
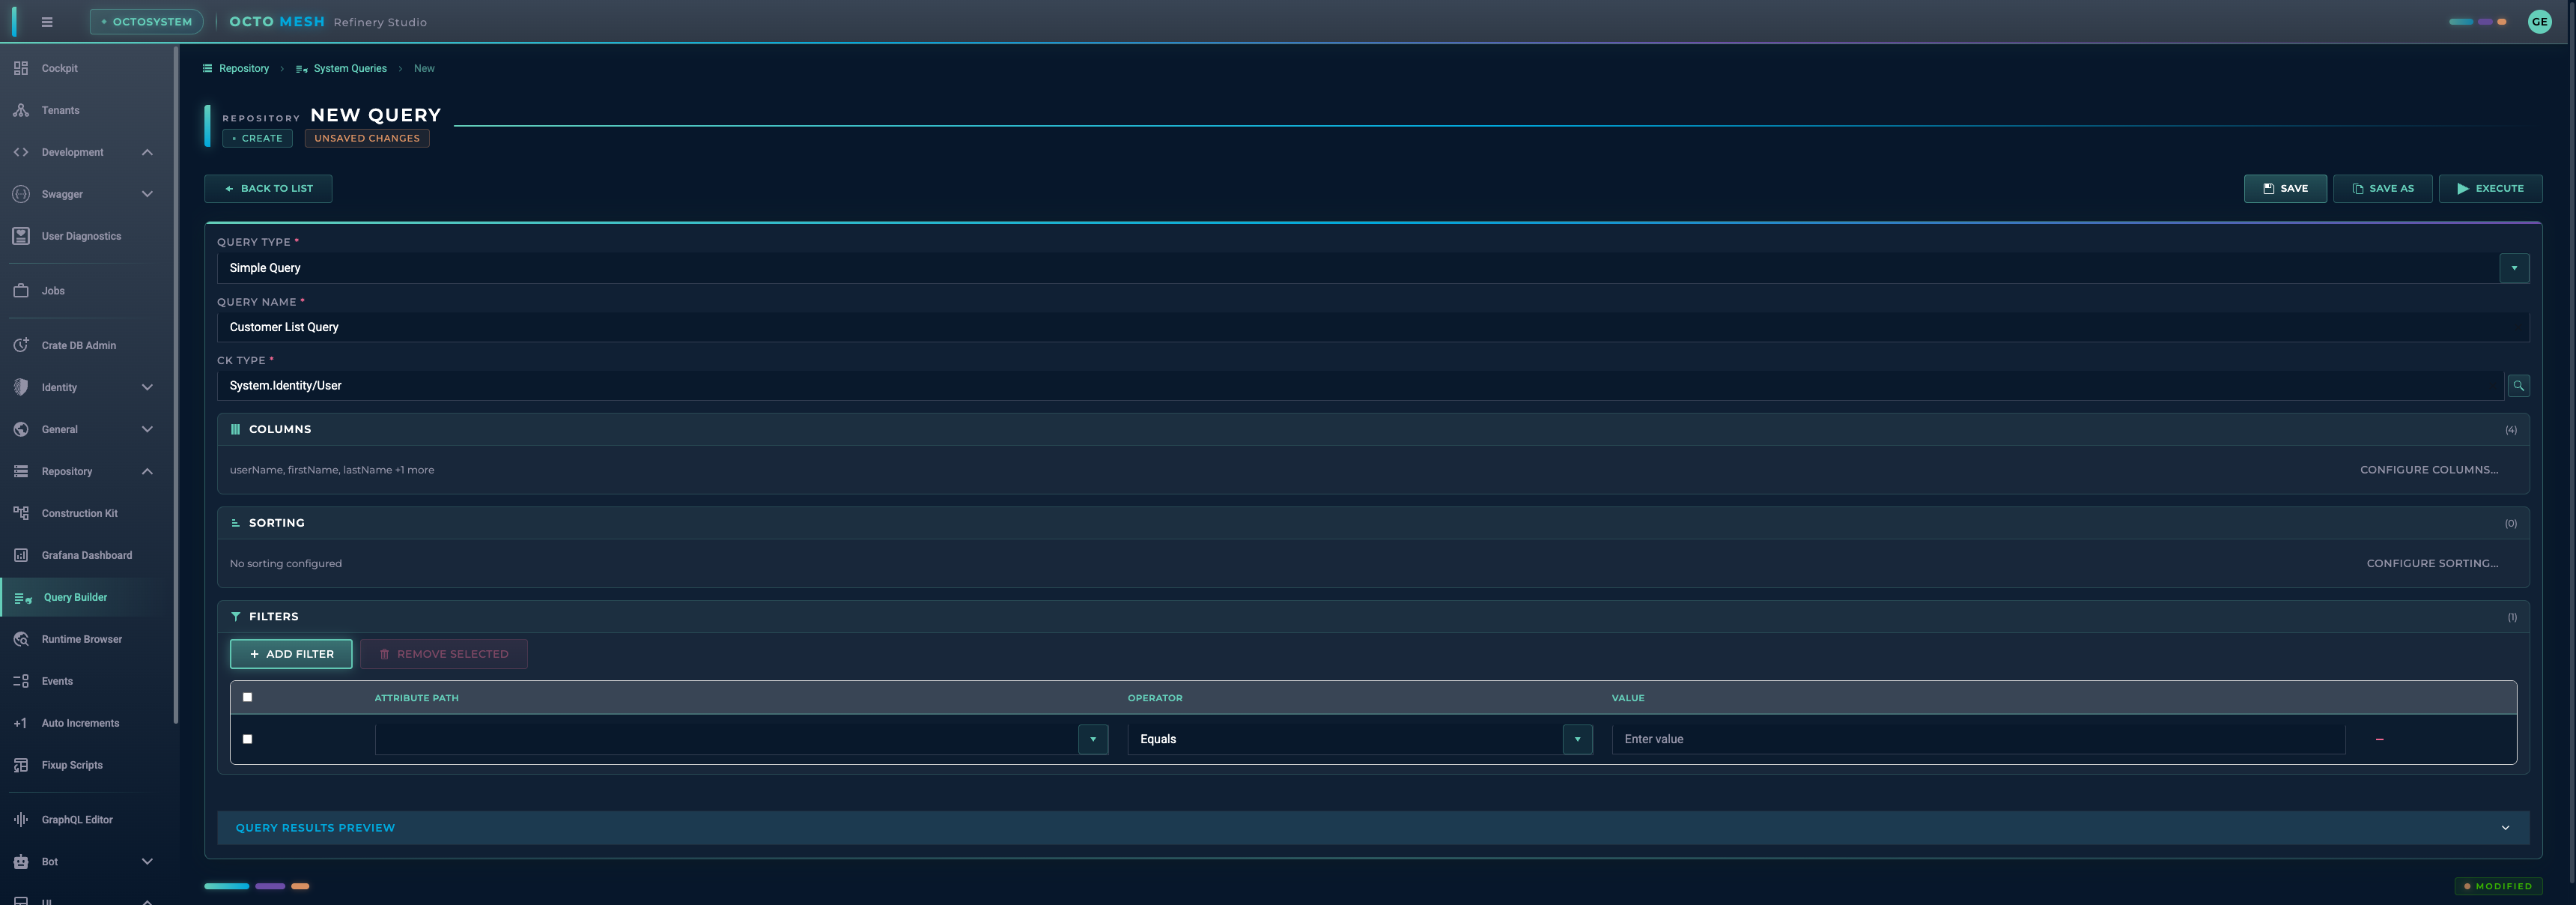
Each filter consists of:
- Attribute: The attribute to filter on
- Operator: The comparison operator
- Value: The value to compare against
Filter Attributes
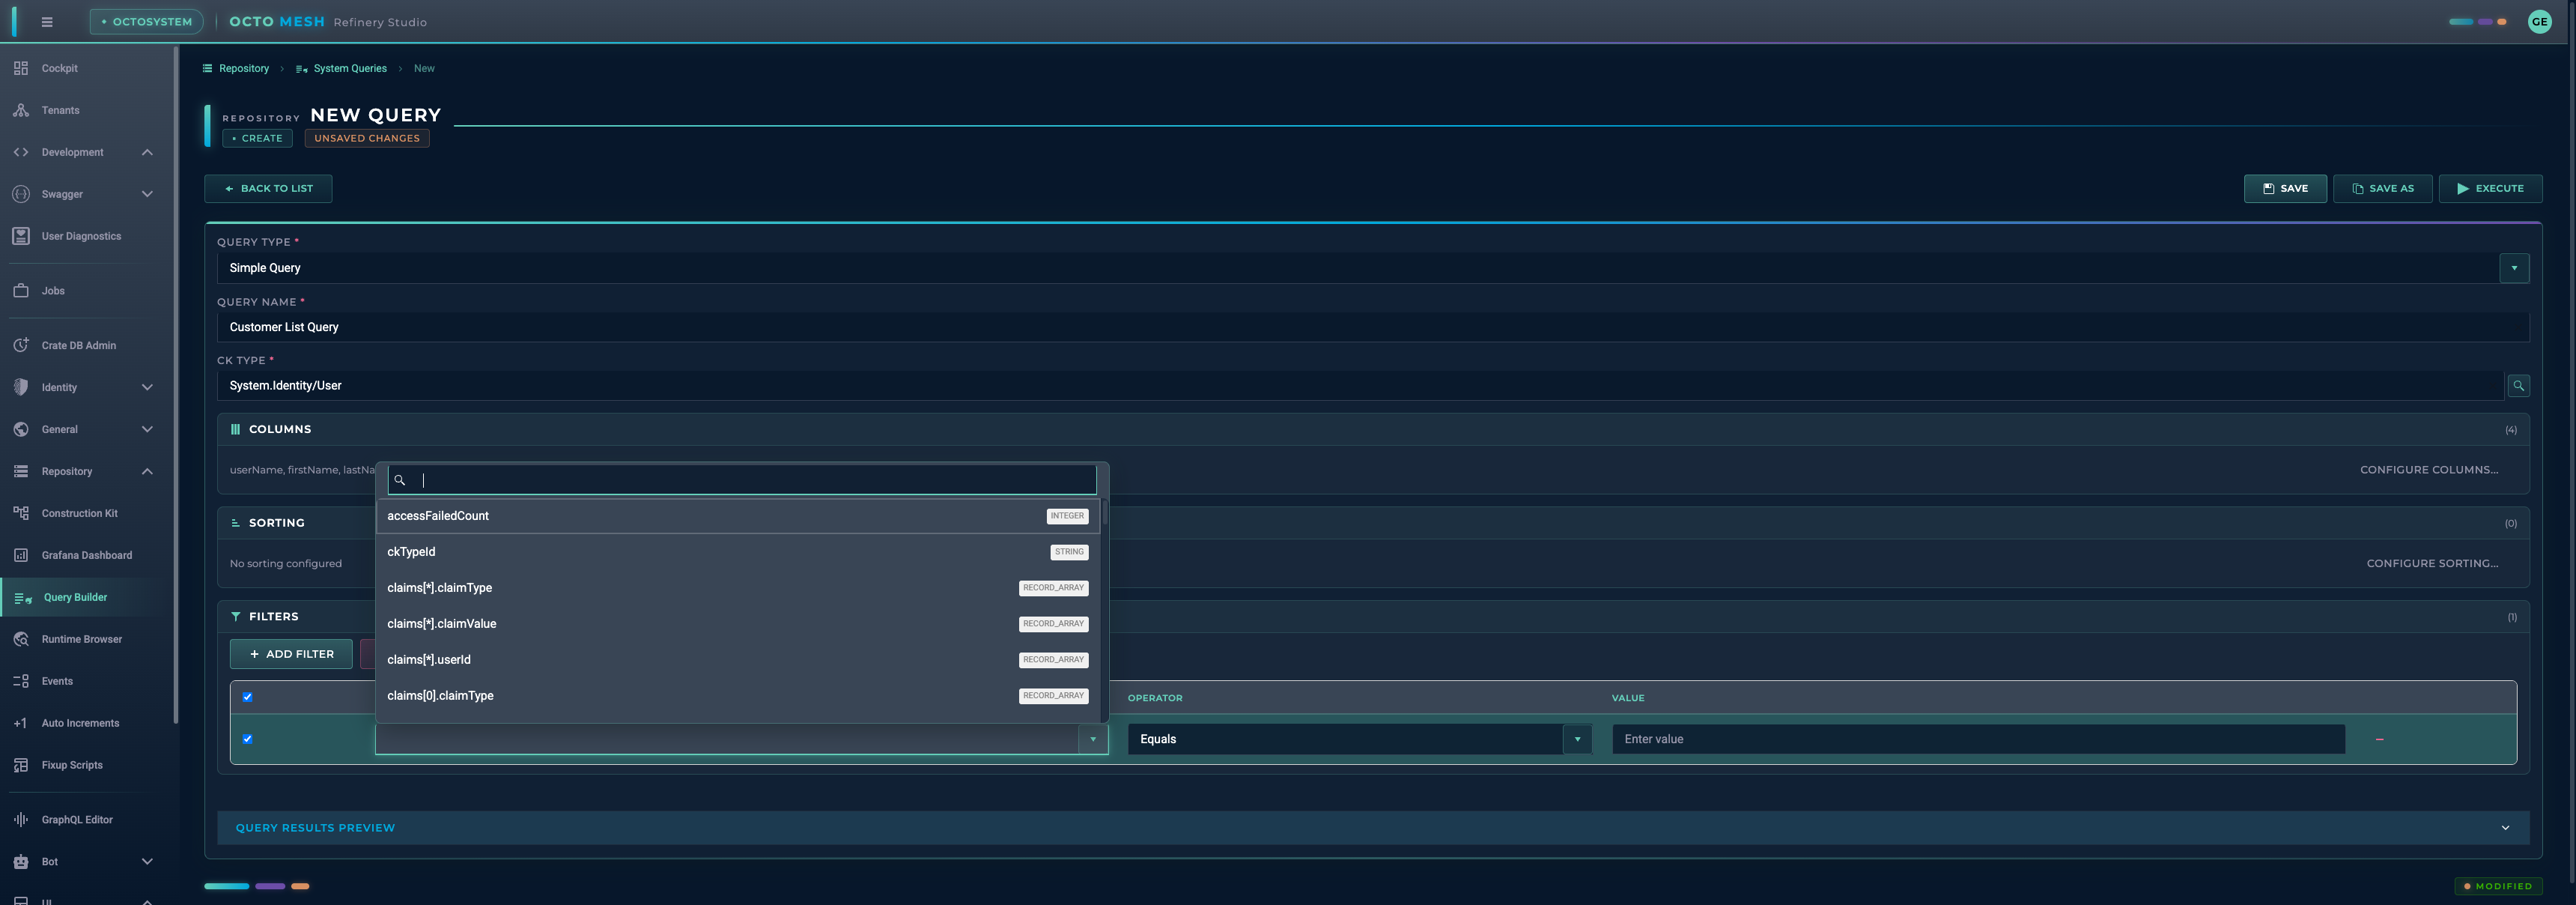
The attribute dropdown shows all available attributes with their data types. The value input adapts based on the attribute type:
- Boolean attributes show a toggle
- String attributes show a text input
- Number attributes show a numeric input
- Date attributes show a date picker
Filter Operators
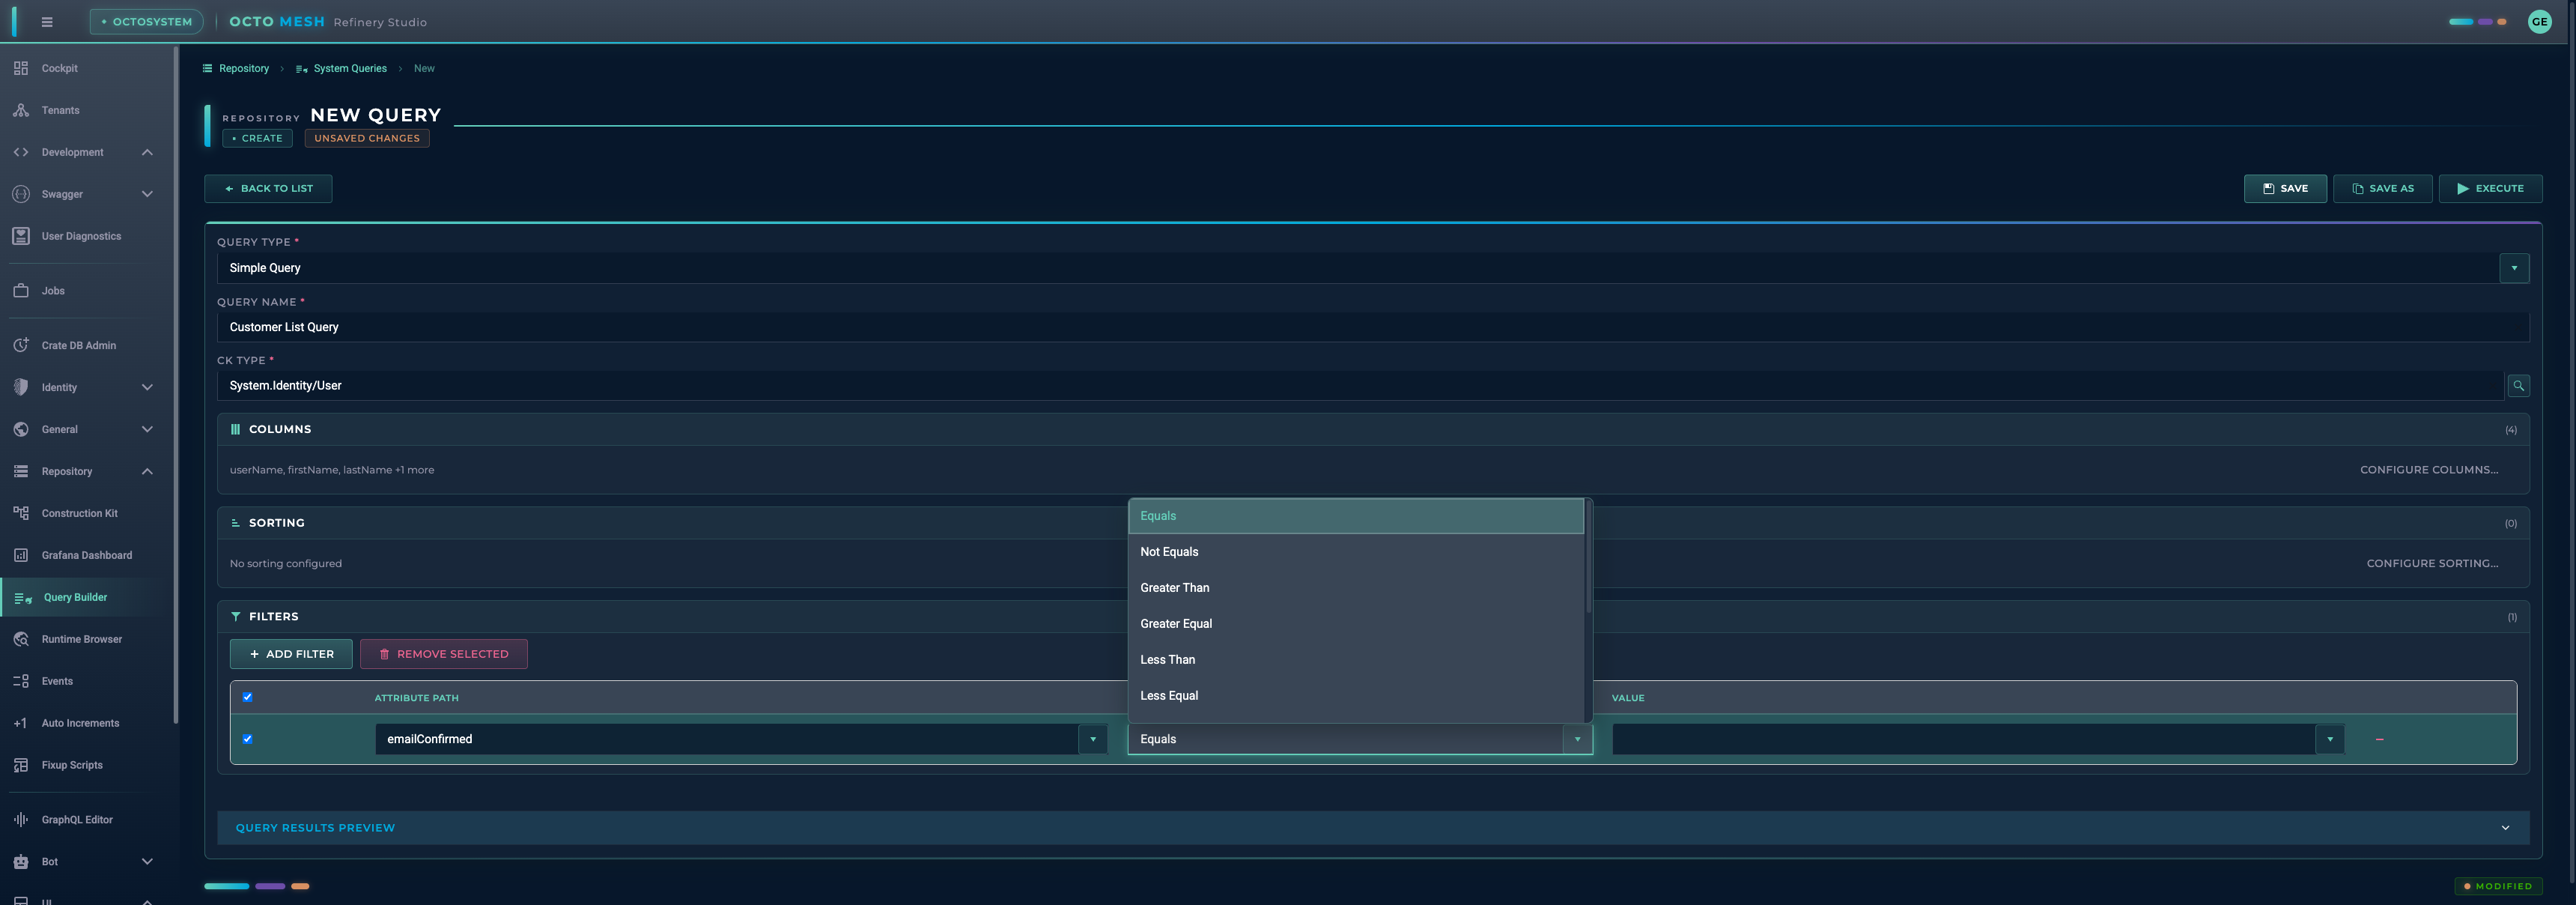
| Operator | Description |
|---|---|
| Equals | Exact match |
| Not Equals | Does not match |
| Greater Than | Value is greater than |
| Greater Equal | Value is greater than or equal to |
| Less Than | Value is less than |
| Less Equal | Value is less than or equal to |
| Like | Pattern match (use % as wildcard) |
| In | Value is in a list |
| Not In | Value is not in a list |
| Any Equals | Any array element matches |
| Any Like | Any array element matches pattern |
| Match RegEx | Regular expression match |
Multiple Filters
You can add multiple filters. All filters are combined with AND logic (all conditions must be true).
Aggregation Queries
Aggregation queries calculate summary statistics instead of returning individual entities.
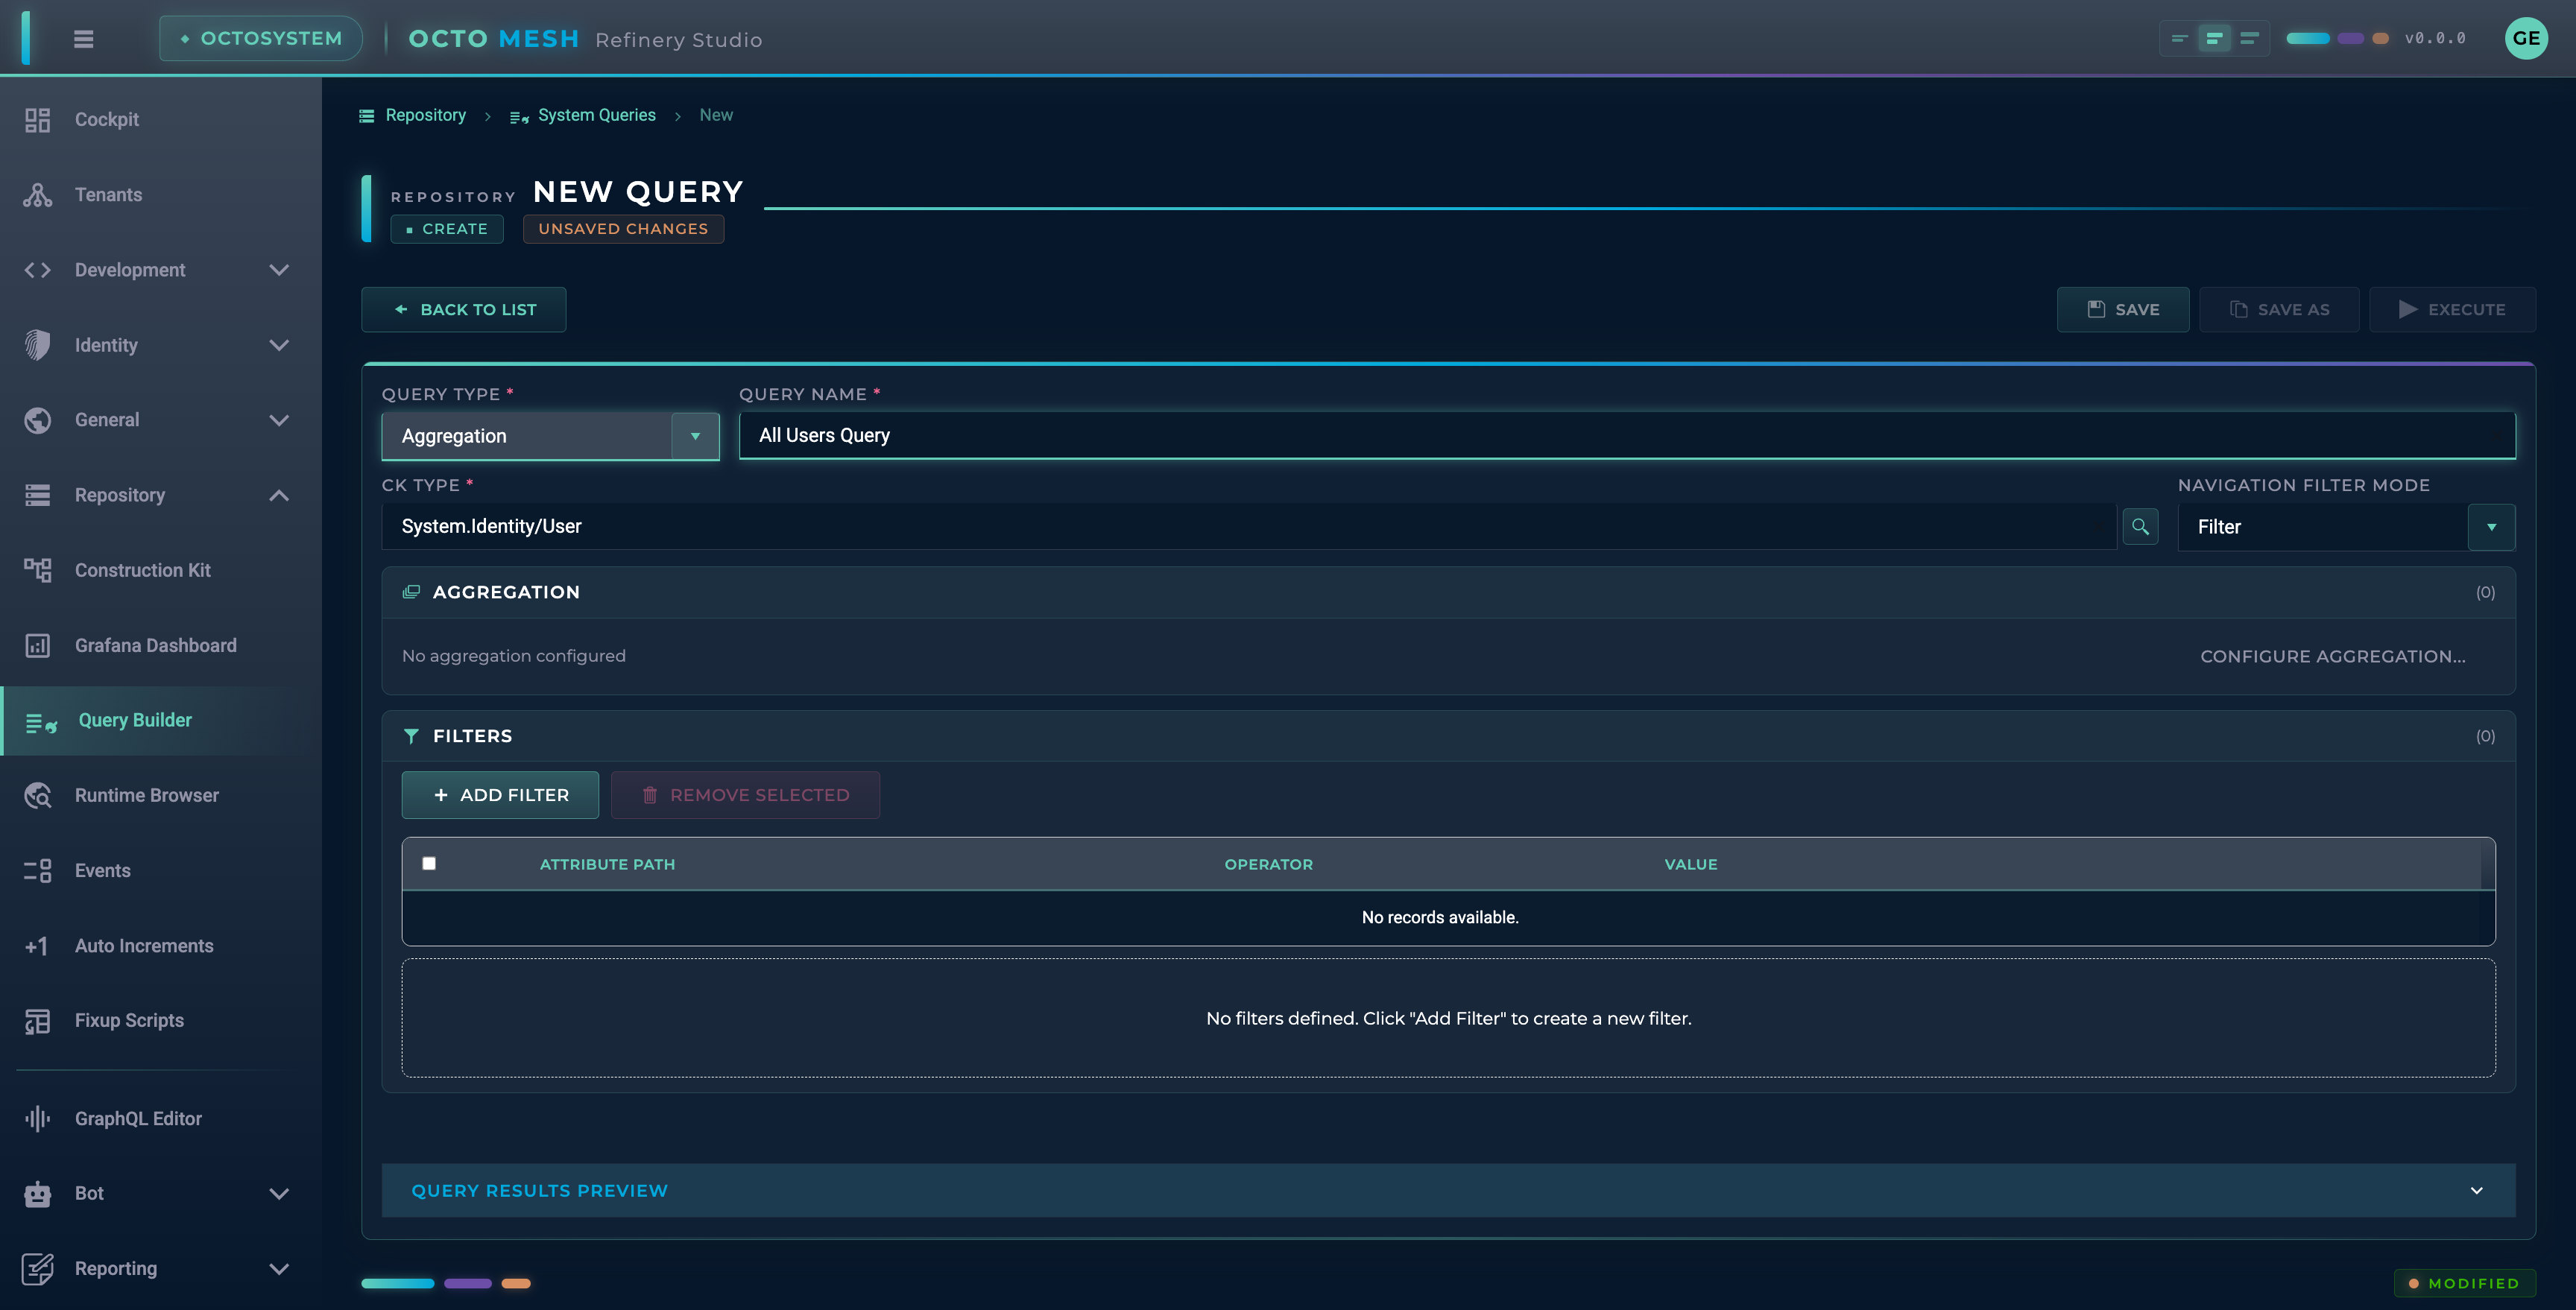
For Aggregation queries, the COLUMNS and SORTING sections are replaced with an AGGREGATION section.
Configuring Aggregations
Click ADD AGGREGATION to open the aggregation dialog.
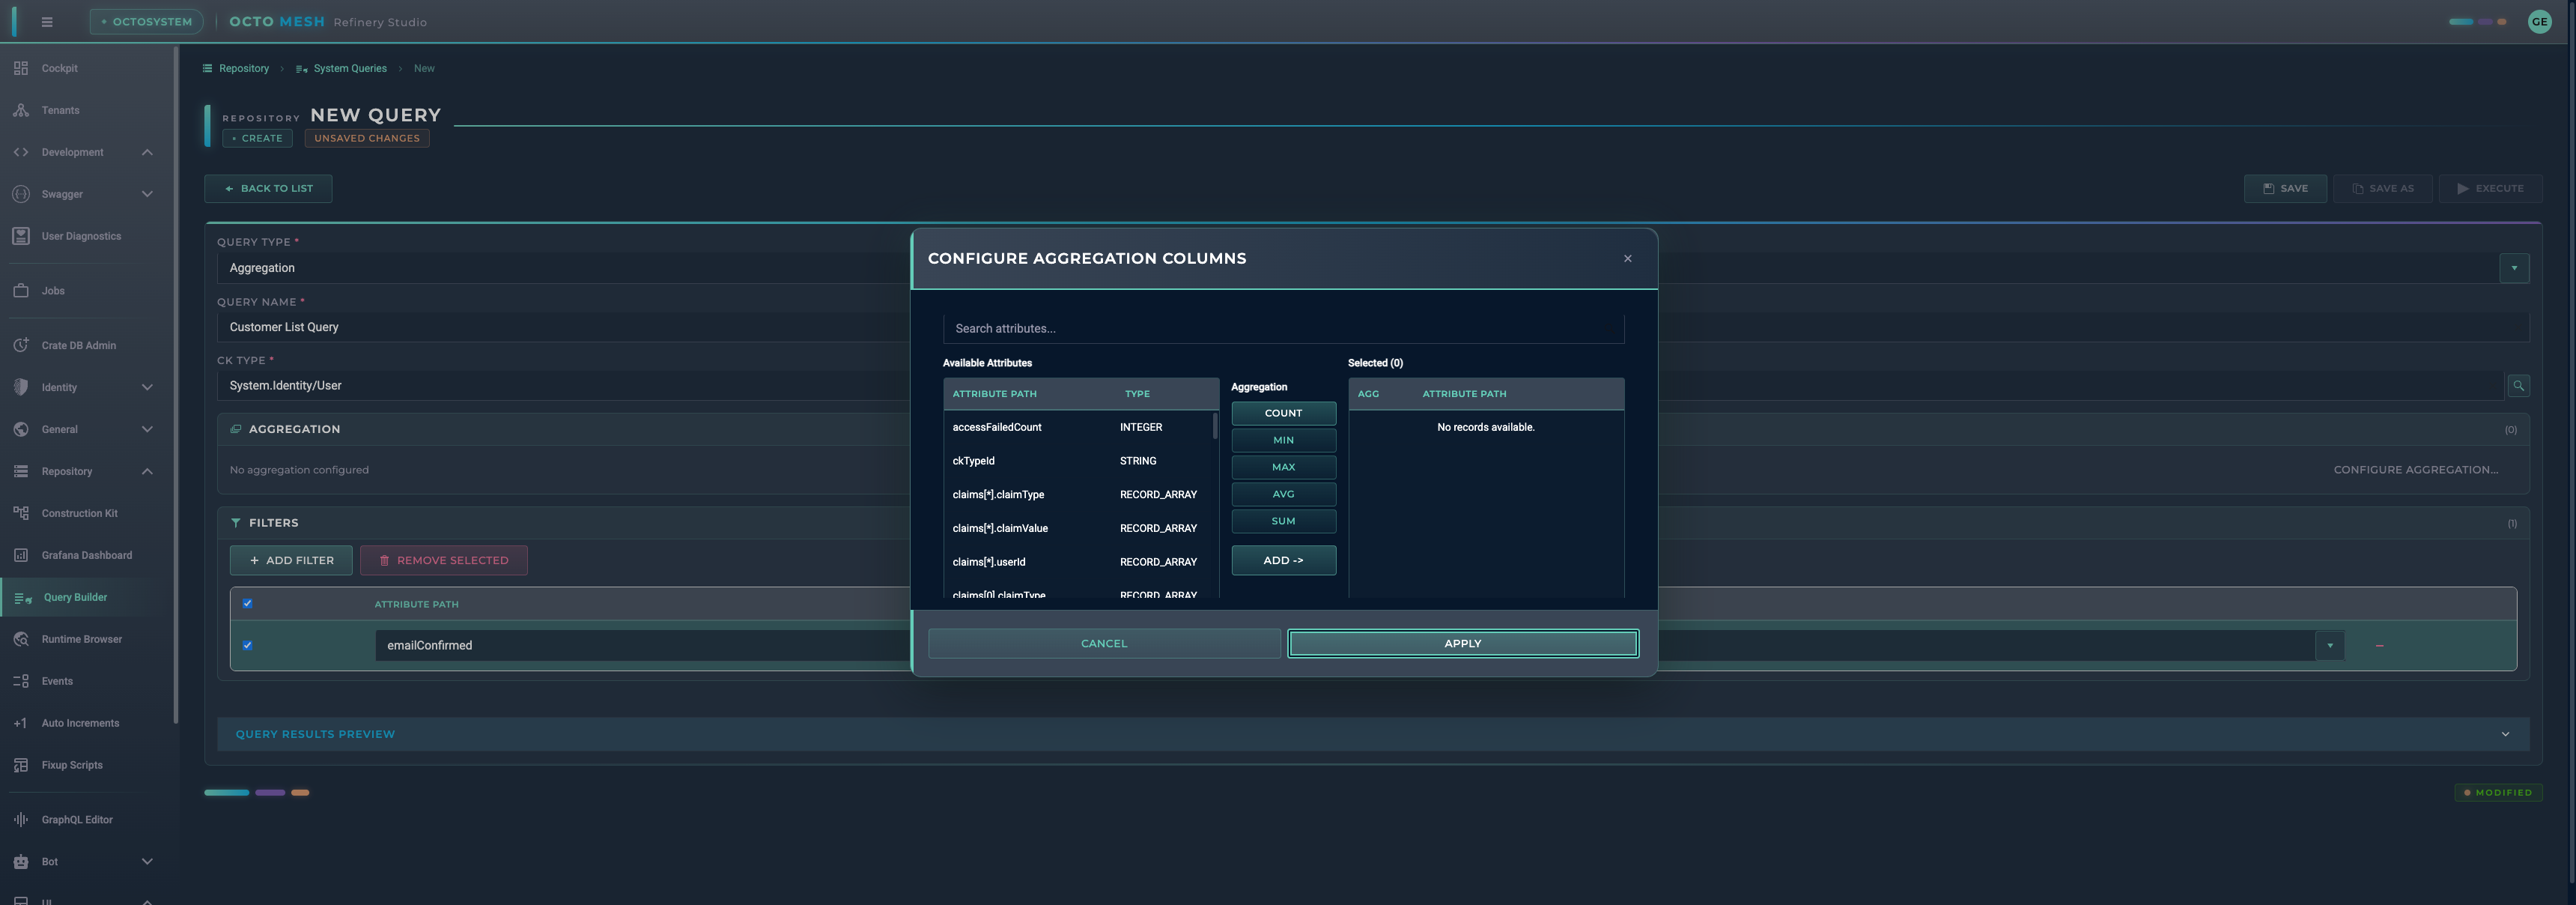
Configure each aggregation:
| Field | Description |
|---|---|
| Function | The aggregation function (COUNT, MIN, MAX, AVG, SUM) |
| Attribute | The attribute to aggregate (not needed for COUNT) |
| Name | Display name for the aggregation result |
Aggregation Functions
| Function | Description |
|---|---|
| COUNT | Count of matching entities |
| MIN | Minimum value |
| MAX | Maximum value |
| AVG | Average (mean) value |
| SUM | Total sum of values |
Grouped Aggregation Queries
Grouped Aggregation queries combine grouping with aggregation. Results are grouped by one attribute, and aggregations are calculated for each group.
Configuration includes:
- Group By: The attribute to group results by
- Aggregations: One or more aggregation functions
Example: Group users by department and count users per department.
Executing Queries
Click EXECUTE to run the query and see results. The results are displayed in a table format below the query configuration.
Saving Queries
Click SAVE to save the query configuration. Saved queries appear in the Query Builder list and can be:
- Reused for data exploration
- Referenced in MeshBoard widgets
- Shared across the tenant
Stream Data Queries
In addition to runtime entity queries, the Query Builder supports querying time-series data stored in CrateDB. Stream data queries let you retrieve, aggregate, and downsample historical measurements such as sensor readings, machine metrics, or energy production values.
For the underlying GraphQL API details, see the Stream Data Access technology guide.
Stream Data Query Types
When creating a new query, the following stream data query types are available in the Query Type selector:
| Type | Description |
|---|---|
| Stream Data Query | Retrieve raw time-series data points with column selection |
| Stream Data Aggregation | Compute aggregated values (AVG, MIN, MAX, COUNT, SUM) across time-series data |
| Stream Data Grouped Aggregation | Aggregate time-series data grouped by one or more columns |
| Stream Data Downsampling | Reduce data density by bucketing time ranges with per-bucket aggregation |
Selecting a CK Type for Stream Data
When a stream data query type is selected, the CK Type selector only shows types that have stream data enabled (IsStreamType). Select the type whose time-series data you want to query (e.g., Industry.Energy/EnergyMeter).
Stream Data Simple Query Configuration
For stream data simple queries, the configuration is similar to runtime simple queries:
- Columns: Select which data stream attributes to include in the results (e.g.,
voltage,power). Only attributes marked as data stream attributes are available. - Time Range: Use the From and To date pickers to restrict the query to a specific time window.
- Limit: Set the maximum number of data points to return.
- Sorting: Add sort rules to control the order of results (e.g., sort by
timestampdescending for most recent first). - Filters: Add field filters to narrow results based on attribute values, using the same operators as runtime queries.
Stream Data Aggregation Configuration
For stream data aggregation queries:
- Aggregation Columns: Select attributes and assign an aggregation function to each:
- AVG — average value
- MIN — minimum value
- MAX — maximum value
- COUNT — number of data points
- SUM — sum of values
- Time Range: Optional from/to restriction.
- Limit: Maximum rows to return.
- Filters: Optional field-level filters applied before aggregation.
Stream Data Grouped Aggregation Configuration
For stream data grouped aggregation queries:
- Group By: Select one or more attributes to group results by (e.g., group by
rtIdto get per-entity aggregations). - Aggregation Columns: Same as aggregation queries — select attributes with aggregation functions.
- Time Range, Limit, and Filters: Same as above.
Stream Data Downsampling Configuration
Downsampling divides a time range into equal-sized buckets and computes an aggregation per bucket. This is ideal for chart and dashboard visualizations.
- Aggregation Columns: Select attributes with aggregation functions (AVG, MIN, MAX).
- From and To: Required — define the time range to downsample.
- Limit: Required — the number of time buckets to produce. The bucket size is calculated as
(to - from) / limit. For example, a 24-hour range with limit 24 produces hourly buckets. - Filters: Optional field-level filters.
Executing and Viewing Stream Data Results
Click EXECUTE to run the stream data query. Results are displayed in a table format with:
- Timestamp: The time of each data point (or bucket start for downsampling)
- Entity: The runtime entity (
rtId/rtWellKnownName) the data belongs to - Data columns: The requested attribute values or aggregated results
Results support pagination for large datasets.
Saving Stream Data Queries
Click SAVE to persist the stream data query. Saved stream data queries can be:
- Re-executed from the Query Builder list
- Used as data sources in MeshBoard widgets (KPI, Gauge, Chart, Table)
- Referenced by external tools such as Power BI or Grafana
Best Practices
- Name queries descriptively: Use clear names that indicate what the query returns
- Use filters effectively: Narrow down results to improve performance
- Select only needed columns: Include only attributes you need to reduce data transfer
- Test before saving: Execute the query to verify results before saving
- Use aggregations for summaries: Use aggregation queries instead of fetching all data and calculating client-side
- Consider performance: Complex queries on large datasets may take longer to execute
- Use downsampling for charts: When visualizing time-series data on dashboards, use downsampling to reduce data points to a manageable number matching your chart resolution
- Set time ranges: For stream data queries, always set a time range to avoid querying the entire history
Use Cases
Data Exploration
- Browse entities of a specific type
- Search for entities matching criteria
- View entity attributes and relationships
Time-Series Analysis
- View historical sensor readings for a specific machine
- Compare voltage trends across multiple energy meters
- Identify anomalies in measurement data
Reporting
- Count entities by status
- Calculate averages and totals
- Group and summarize data
- Generate periodic summaries of time-series metrics
Dashboard Data Sources
- Create queries for MeshBoard widgets
- Build reusable data extractions
- Set up filtered views for specific use cases
- Use downsampling queries for time-series chart widgets
Power BI Integration
- Use saved queries as data sources for Power BI reports and dashboards
- Leverage aggregation queries for pre-calculated summaries in Power BI
Grafana Integration
- Connect saved queries to Grafana dashboards for real-time monitoring
- Use aggregation queries for time-series and metric visualizations